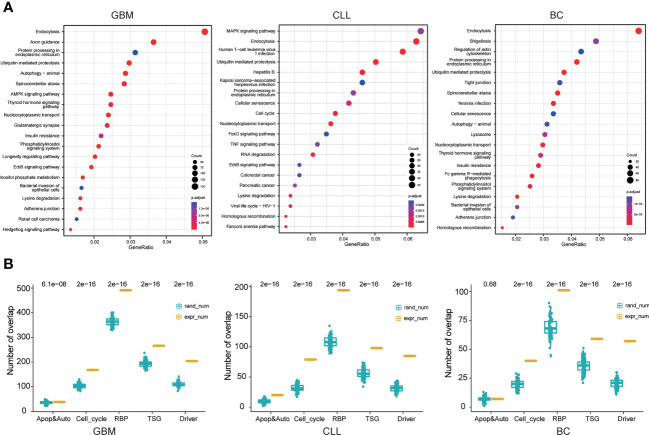
Figure 5.
Neoepitope gene function analysis. (A) KEGG pathway analysis of the circRNAs in GBM, CLL, and BC patients. (B) Functional analysis of circRNA-derived neoepitopes. The yellow bars and blue bars represent the number of circRNA-derived neoepitope genes and the number of randomly selected coding genes, respectively, in apoptosis and autophagy, cell cycle, RNA binding protein (RBP), tumor suppressor gene (TSG), and cancer-related gene sets.

