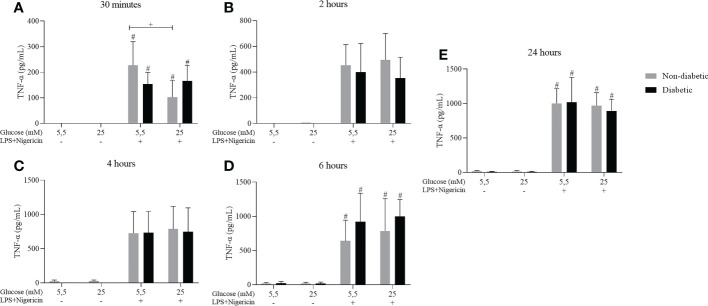
Figure 5.
TNF-α secretion by ND-BMDM and D-BMDM with Nigericin priming and LPS stimulation. IL-6 release after (A) 30 minutes with different glucose concentrations. #P<0.05 stimulated vs non stimulated. + P<0.05 D-BMDM 25Mm+ vs ND-BMDM 25mM-. (B) 2 hours with different glucose concentrations. (C) 4 hours with different glucose concentrations. (D) 6 hours with different glucose concentrations. #P<0.05 stimulated vs non stimulated (E) 24 hours with different glucose concentrations. #P<0.05 stimulated vs non stimulated. TNF-α measurement was performed by enzyme-linked immunosorbent assay. Results represent mean ± SEM. N = 7-13. BMDM: Bone-Marrow Derived Macrophages, from diabetic (D-) and non-diabetic (ND-) C57BL/6 mice.

