Figure 3.
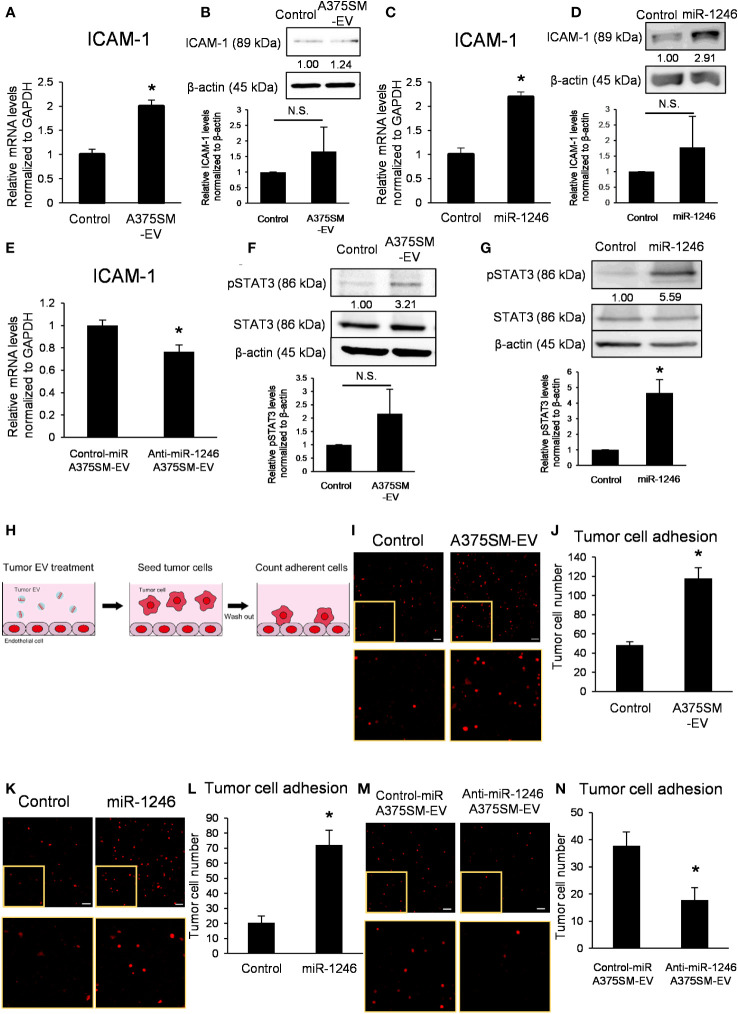
miR-1246 in high metastatic tumor EVs activates STAT3 in ECs, resulting in the induction of ICAM-1 expression. (A) ICAM-1 mRNA levels in iHMVECs treated with A375SM-EVs for 12 h were examined by qRT-PCR. PBS was used as the control. Data are presented as mean ± SD; n = 4 real-time RT-PCR runs (*P = 0.00012 vs. control, two-sided Student’s t-test). (B) The levels of ICAM-1 in iHMVECs treated with A375SM-EVs for 48 h were determined using western blotting. PBS was used as the control. β-Actin was used as an internal control. The level of ICAM-1 was normalized to that of β-actin by scanning densitometry using Image J. Data are presented as mean ± SD; n = 3 (vs. control, two-sided Student’s t-test) N.S.: not significant. P = 0.22 (C) ICAM-1 mRNA levels in iHMVECs 48 h after miR-1246 transfection were examined by qRT-PCR. microRNA Mimic Negative Control was used as the control. Data are presented as mean ± SD; n = 4 real-time RT-PCR runs (*P < 0.0001 vs. control, two-sided Student’s t-test). (D) The levels of ICAM-1 in iHMVECs 48 h after miR-1246 transfection were determined using western blotting. microRNA Mimic Negative Control was used as control. β-Actin was used as an internal control. The level of ICAM-1 was normalized to that of β-actin by scanning densitometry using Image J. Data are presented as mean ± SD; n = 3 (vs. control, two-sided Student’s t-test) N.S.: not significant. P = 0.24 (E) ICAM-1 mRNA levels in iHMVECs treated with Anti-miR-1246 A375SM-EVs for 12 h were examined by qRT-PCR. Data are presented as mean ± SD; n = 4 real-time RT-PCR runs (*P = 0.0019 vs. control-miR A375SM-EVs, two-sided Student’s t-test). (F) The levels of pSTAT3 in iHMVECs treated with A375SM-EVs for 30 min were determined by western blotting. STAT3 and β-actin were used as an internal control. The level of pSTAT3 was normalized to that of β-actin by scanning densitometry using Image J. Data are presented as mean ± SD; n = 3 (vs. control, two-sided Student’s t-test) N.S.: not significant. P = 0.094 (G) The levels of pSTAT3 in iHMVECs 24 h after miR-1246 transfection were determined by western blotting. microRNA Mimic Negative Control was used as the control. STAT3 and β-actin were used as an internal control. The level of pSTAT3 was normalized to that of β-actin by scanning densitometry using Image J. Data are presented as mean ± SD; n = 3 (*P = 0.0018 vs. control, two-sided Student’s t-test) (H) The schematic of adhesion assay. (I) Representative fluorescent images of adherent tdTomato-luc2-expressing A375 cells to iHMVEC monolayer treated with A375SM-EVs. The lower panel shows an enlarged image of the regions marked with yellow rectangles. PBS was used as the control. (J) The number of tdTomato-luc2 A375 cells was counted. Data are presented as mean ± SD; n = 5 fields. Scale bar: 100 µm (*P < 0.0001 vs. control, two-sided Student’s t-test). (K) Representative fluorescent images of adherent tdTomato-luc2-expressing A375 cells to miR-1246 transfected iHMVEC monolayer. The lower panel shows an enlarged image of the regions marked with yellow rectangles. microRNA Mimic Negative Control was used as the control. (L) The number of tdTomato-luc2 A375 cells was counted. Data are presented as mean ± SD; n = 5 fields. Scale bar: 100 µm (*P < 0.0001 vs. control, two-sided Student’s t-test). (M) Representative fluorescent images of adherent tdTomato-luc2-expressing A375 cells to iHMVEC monolayer treated with Anti-miR-1246 A375SM-EVs. The lower panel shows an enlarged image of the regions marked with yellow rectangles. (N) The number of tdTomato-luc2 A375 cells was counted. Data are presented as mean ± SD; n = 5 fields. Scale bar: 100 µm (*P = 0.00018 vs. control-miR A375SM-EVs, two-sided Student’s t-test).

