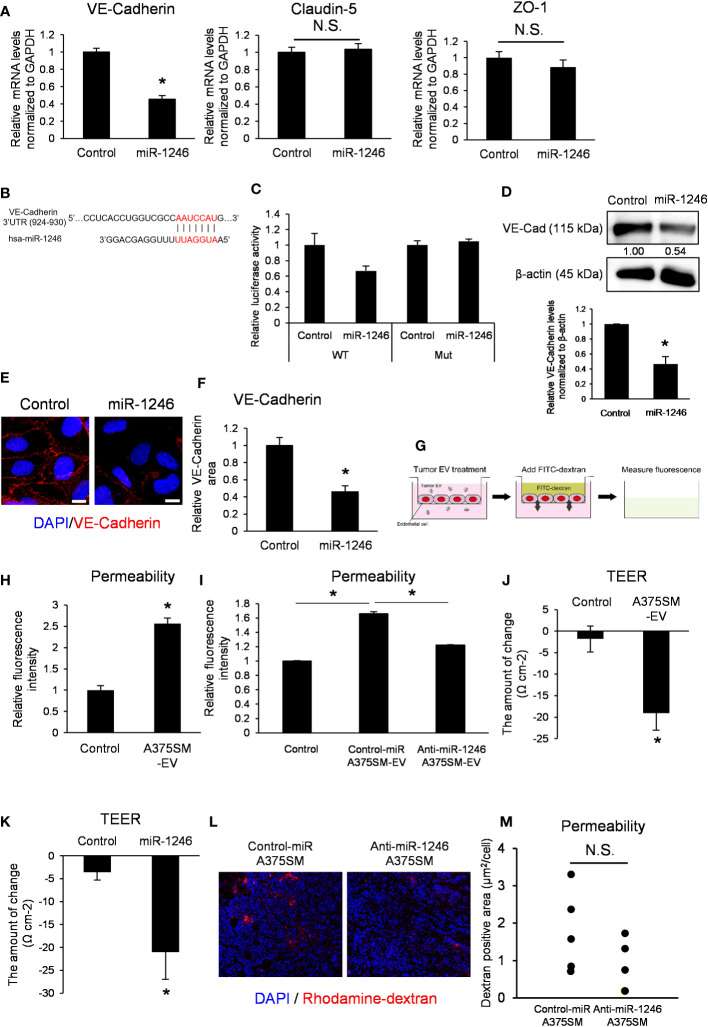
Figure 4.
miR-1246 destroys the EC barrier through VE-Cadherin downregulation. (A) Expression levels of VE-Cadherin, Claudin-5, and ZO-1 mRNA in iHMVECs 48 h after miR-1246 transfection were examined by qRT-PCR. microRNA Mimic Negative Control was used as the control. Data are presented as mean ± SD; n = 4 real-time RT-PCR runs (*P = 0.0075 vs. control, two-sided Student’s t-test). N.S.: not significant. P = 0.45 (Claudin-5), 0.095 (ZO-1). (B) The binding position between hsa-miR-1246 and 3′ UTR of VE-Cadherin was predicted using TargetScan (http://www.targetscan.org). (C) Relative luciferase activities of HEK293 cells transfected with miR-1246 mimic and 3′ UTR of VE-Cadherin (P =0.088 (WT), 0.44 (Mut) vs. control, two-sided Student’s t-test). microRNA Mimic Negative Control was used as the control. Data are presented as mean ± SD; n = 4. (D) The levels of VE-Cadherin in miR-1246 transfected iHMVECs were determined by western blotting. microRNA Mimic Negative Control was used as the control. β-Actin was used as an internal control. The level of VE-Cadherin was normalized to that of β-actin by scanning densitometry using Image J. Data are presented as mean ± SD; n = 3 (*P = 0.00084 vs. control, two-sided Student’s t-test). (E) Representative images of VE-Cadherin immunostaining (red) and DAPI nuclear staining (blue) in miR-1246 transfected iHMVECs. (F) The quantitative analysis of the VE-Cadherin staining area in miR-1246 transfected iHMVECs (E) was calculated using ImageJ (*P < 0.0001 vs. control, two-sided Student’s t-test). Data are presented as mean ± SD; n = 8 fields. Scale bar: 10 µm. (G) The schematic of permeability assay. The leakage of FITC-dextran was measured using a microplate reader. (H) Permeability assay was performed in iHUVECs treated with A375SM-EVs. PBS was used as the control (*P < 0.0001 vs. control, two-sided Student’s t-test). Data are presented as mean ± SD; n = 3. (I) Permeability assay was performed in iHUVECs treated with Control-miR or Anti-miR-1246 A375SM-EVs (*P < 0.0001 vs. control-miR A375SM-EVs, one-way ANOVA, followed by a Tukey–Kramer multiple comparison tests). PBS was used as the control. Data are presented as mean ± SD; n = 3. (J) Changes of TEER in HUVECs treated with A375SM-EVs were examined by TEER assay (*P = 0.0038 vs. control, two-sided Student’s t-test). PBS was used as the control. Data are presented as mean ± SD; n = 3. (K) Changes of TEER in miR-1246 transfected HUVECs were examined (*P = 0.0079 vs. control, two-sided Student’s t-test). Data are presented as mean ± SD; n = 3. (L) Representative images of rhodamine-dextran (red) leaked in the tumors of rhodamine-dextran-injected tumor-bearing mice. Blue signals represent cell nuclei (DAPI). Quantitative analysis of leaked dextran was shown in (M) (two-sided Student’s t-test; n =5 fields in each tumor; n = 5 mice per group N.S.: not significant P = 0.21).

