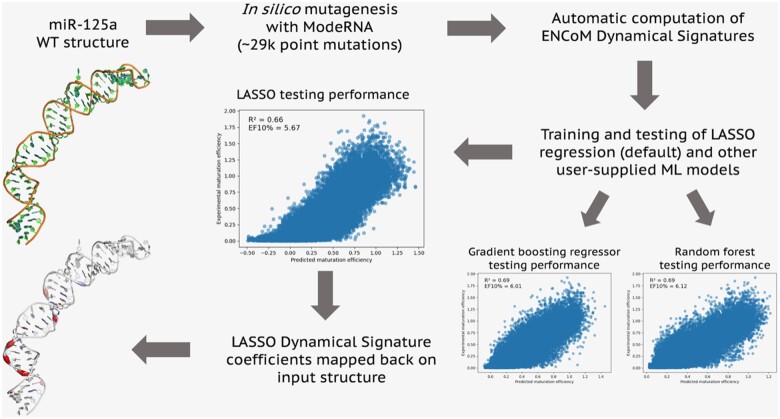
Figure 1.
ENCoM-DynaSig-ML pipeline applied to miR-125a maturation efficiency data. The MC-Fold | MC-Sym (Parisien and Major 2008) predicted 3D structure of WT miR-125a is used as a template to perform the 29 477 point mutations with experimental maturation efficiency data using the ModeRNA software (Rother et al. 2011), all subsequent steps are performed using DynaSig-ML. For each of the in silico variants, a Dynamical Signature is computed with ENCoM. LASSO regression models with varying regularization strengths are trained by default, using as input variables the Dynamical Signatures and other user-supplied data (here, MC-Fold enthalpy of folding for each variant). Other ML models can be user-specified (here, gradient boosting regressor and random forest regressors). In the case of the LASSO regression model, the independence of the input variables allows the mapping of the learned coefficients back on the miR-125a structure. The color gradient represents each coefficient, from blue for negative coefficients, to white for null coefficients and red for positive coefficients. The largest absolute value coefficient will have the brightest color. The sign of a coefficient captures the nature of the relationship between flexibility changes at that position and the experimental property of interest (in this case, maturation efficiency). Negative coefficients mean that rigidification of the position leads to higher efficiency, while positive coefficients mean that softening of that position leads to higher efficiency. The thickness of the cartoon represents the absolute value of the coefficients, i.e. their relative importance in the model. In the present example, the positive coefficients on the backbone of base pairs 7, 9, and 11 identify the well-known mismatched GHG motif (Fang and Bartel 2015)

