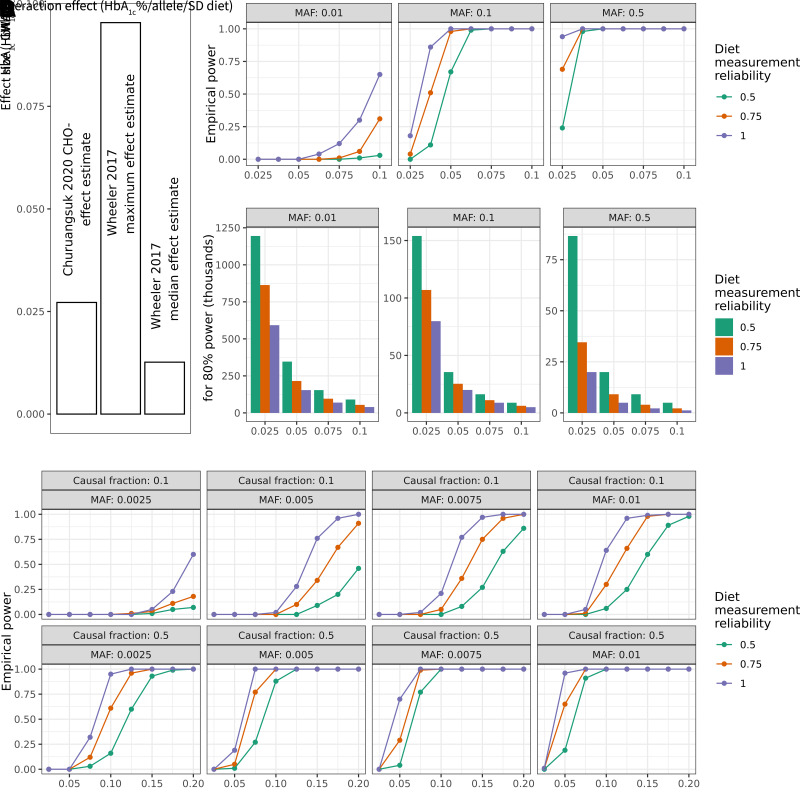
Figure 2.
Power calculations for gene–environment interaction incorporating exposure measurement error. For all plots above, HbA1c is used as a basis for parameter choices. A: Genetic and dietary effect sizes on HbA1c for reference for potential interaction effects. Bars are annotated with the source study, either Churuangsuk et al. (28) or Wheeler et al. (27). B: Simulation-based empirical power estimates are shown as a function of the interaction effect (x-axis), MAF (panels left to right), and diet measurement reliability (colors). C: Bar plots show the estimated sample size needed to achieve 80% statistical power. Panels and colors are as in B. D: As in A, but modeling empirical power for simulated aggregate tests of 20 rare variants with a causal fraction of 0.1 or 0.5 (indicated in panel labels). Additional assumptions for these simulations (full details in Research Design and Methods): N = 35,000; phenotype mean of 5.5; phenotype SD of 0.5; exposure mean of 0; exposure SD of 1; genetic main effect of 0.01; and environmental main effect of 0.2.

