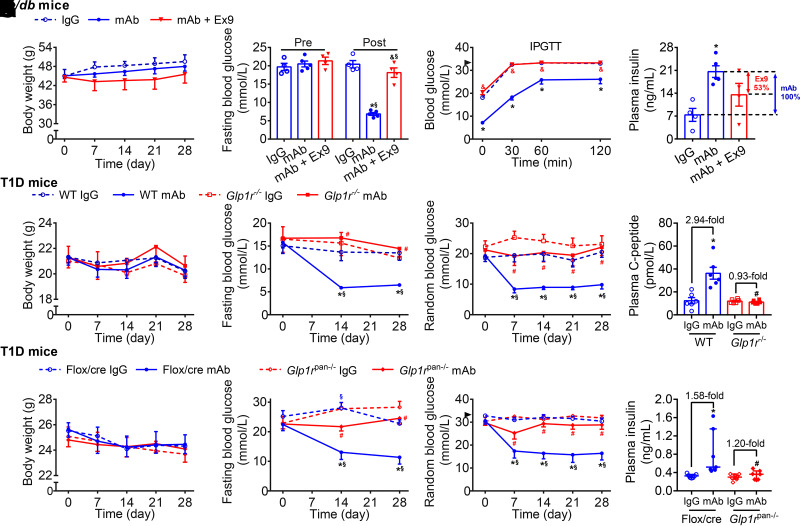
Figure 2.
Systemic or pancreatic GLP-1R signaling participates in glucose-lowering and insulinotropic effects induced by GCGR antagonism in T2D and T1D mice. A–D: Parameters in db/db mice. Male db/db mice (8 weeks) were treated with IgG (5 mg/kg/week, n = 4), GCGR mAb (5 mg/kg/week, n = 5), or GCGR mAb combined with Ex9 (50 nmol/kg/day, n = 4) for 4 weeks. E–H: Parameters in T1D Glp1r−/− mice and WT Glp1r+/+ littermates. Male and female Glp1r−/− mice and WT littermates were injected with STZ to induce T1D models at the age of 8–12 weeks and treated weekly with IgG (5 mg/kg) or GCGR mAb (5 mg/kg) for 4 weeks (n = 6 mice/group). I–L: Parameters in T1D Glp1rpan−/− mice and Flox/cre littermates. Male Glp1rpan−/− mice and Flox/cre littermates were injected with STZ to induce T1D models at the age of 8−12 weeks and treated weekly with IgG (5 mg/kg, as control) or GCGR mAb (5 mg/kg) for 4 weeks (n = 7 mice/group). A, E, and I: Body weight. B, F, and J: Fasting blood glucose. Blood glucose during intraperitoneal glucose tolerance test (IPGTT) (C) or random blood glucose (G and K). The arrowheads in C and K indicate the upper detection limit (33.3 mmol/L) of the glucometer. Plasma insulin (D and L) or C-peptide (H). Data are expressed as the mean ± SEM or median (interquartile range). Statistical analysis was performed by two-way ANOVA, followed by the Bonferroni multiple comparisons test in A−C, the Tukey multiple comparisons test in E–G and I–K, or by one-way ANOVA, followed by the Bonferroni multiple comparisons test in D, the Tukey multiple comparisons test in H, or by the Kruskal-Wallis test, followed by the Dunn multiple comparisons test in L. *P < 0.05 vs. IgG control in the same genotype of mice; §P < 0.05 vs. pretreatment in the same group; &P < 0.05 vs. GCGR mAb in db/db mice; #P < 0.05 vs. WT or Flox/cre littermates on the same treatment.

