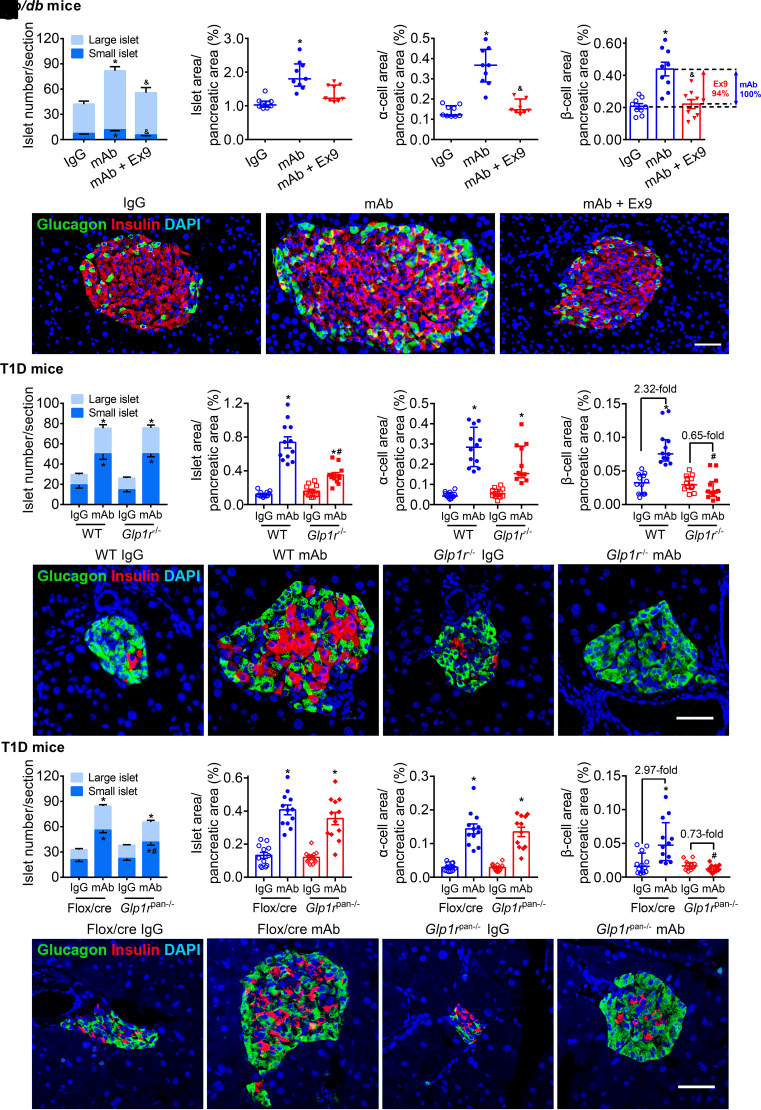
Figure 3.
Systemic or pancreatic GLP-1R signaling contributes to β-cell mass expansion induced by GCGR antagonism in T2D and T1D mice. A–E: Parameters in db/db mice. Male db/db mice (8 weeks) were treated with IgG (5 mg/kg/week), GCGR mAb (5 mg/kg/week), or GCGR mAb combined with Ex9 (50 nmol/kg/day) for 4 weeks. F−J: Parameters in T1D Glp1r−/− mice and WT Glp1r+/+ littermates. Male and female Glp1r−/− mice and WT littermates were injected with STZ to induce T1D models at the age of 8–12 weeks and treated weekly with IgG (5 mg/kg) or GCGR mAb (5 mg/kg) for 4 weeks. K–O: Parameters in T1D Glp1rpan−/− mice and Flox/cre littermates. Male Glp1rpan−/− mice and Flox/cre littermates were injected with STZ to induce T1D models at the age of 8−12 weeks and treated weekly with IgG (5 mg/kg, as control) or GCGR mAb (5 mg/kg) for 4 weeks. A, F, and K: Quantification of the islet number per pancreatic section. An islet with a cell number ≤10 is defined as a small islet and the others as a large islet. B, G, and L: Quantification of the islet area per pancreatic section. C, H, and M: Quantification of the α-cell area per pancreatic section. D, I, and N: Quantification of the β-cell area per pancreatic section (n = 3–4 sections/mouse × 3 mice/group). E, J, and O: Representative images of an islet immunostained for glucagon, insulin, and DAPI. Scale bar = 50 μm. Data are expressed as the mean ± SEM or median (interquartile range). Statistical analysis was performed by one-way ANOVA, followed by the Tukey multiple comparisons test in A and K, the Dunnett T3 multiple comparisons test in D, F, G, L, and M, or by the Kruskal-Wallis test, followed by the Dunn multiple comparisons test in B, C, H, I, and N. *P < 0.05 vs. IgG control in the same genotype of mice; &P < 0.05 vs. GCGR mAb in db/db mice; #P < 0.05 vs. WT or Flox/cre littermates on the same treatment.

