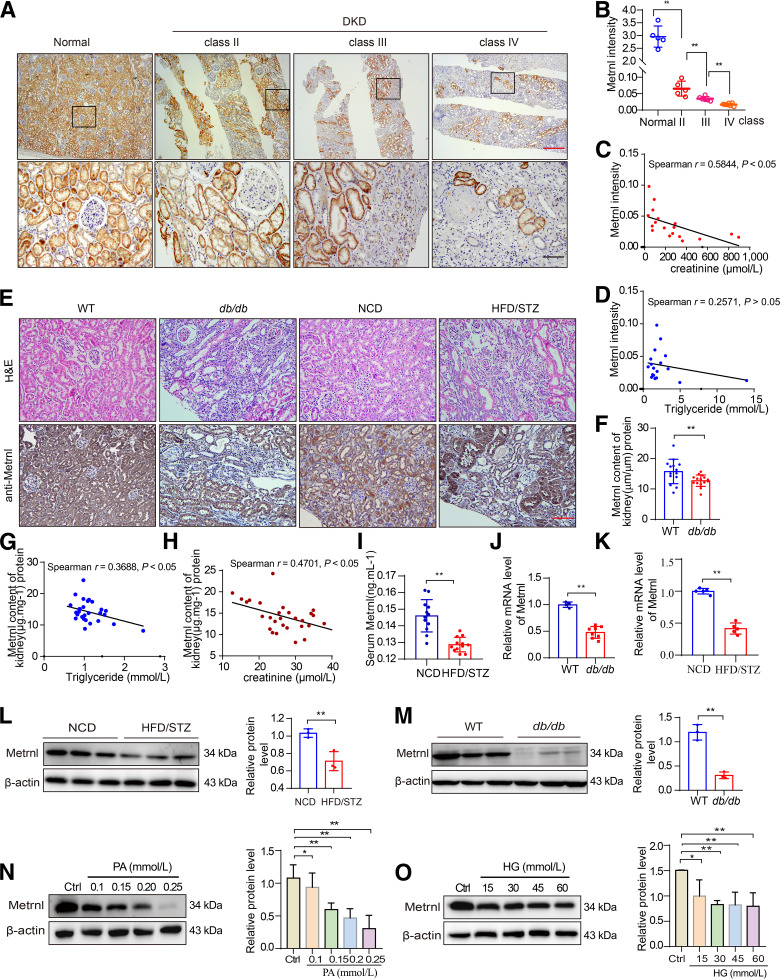
Figure 1.
Reduced expression of Metrnl in the kidneys of diabetic mice and of patients with DKD. A and B: Representative IHC images (A) and quantification (B) of Metrnl expression in human renal cortical tissues from normal kidney poles (n = 5) and patients with mild (class II; n = 5), moderate (class III; n = 6), or severe (class IV; n = 7) histopathological lesions of DKD. Scale bars: red, 500 μm; black, 100 μm. C and D: Correlation between Metrnl expression in human renal cortical tissues from patients with DKD and Scr (n = 18) (C) or serum TG (n = 18) (D) in all patients. E: Representative H-E and IHC images indicating Metrnl protein expression of kidney in 40-week-old db/db mice and STZ/HFD-induced diabetic mice. Scale bar: 100 μm. F: The protein level of Metrnl measured by ELISA in the renal cortex from db/db diabetic mice (wild type [WT], n = 14; db/db, n = 15). F–H: Correlation between Metrnl expression (F) and serum TG (G) or Scr (H) in db/db diabetic mice (WT, n = 14; db/db, n = 15). I: The serum level of Metrnl measured by ELISA in STZ/HFD-induced diabetic mice (n = 12) and NCD-fed mice (n = 12). J and K: qPCR analysis of Metrnl mRNA levels in the renal cortex of db/db diabetic mice (WT, n = 4; db/db, n = 8) (J) and STZ/HFD-induced diabetic mice (NCD, n = 5; STZ/HFD, n = 5) (K). L and M: Representative Western blot and quantification of Metrnl expression in the kidney from STZ/HFD-induced diabetic mice (L) and 40-week-old db/db mice (M), compared with NCD-fed mice and WT mice, respectively. N and O: Representative Western blot and quantification of Metrnl expression in NRK-52E cells exposed to PA (0.1, 0.15, 0.2, and 0.25 mmol/L) (N) or high concentration of glucose (HG) (15, 30, 45, and 60 mmol/L) (O) for 48 h. Data are reported as mean ± SD. *P < 0.05, **P < 0.01. Ctrl, control.

