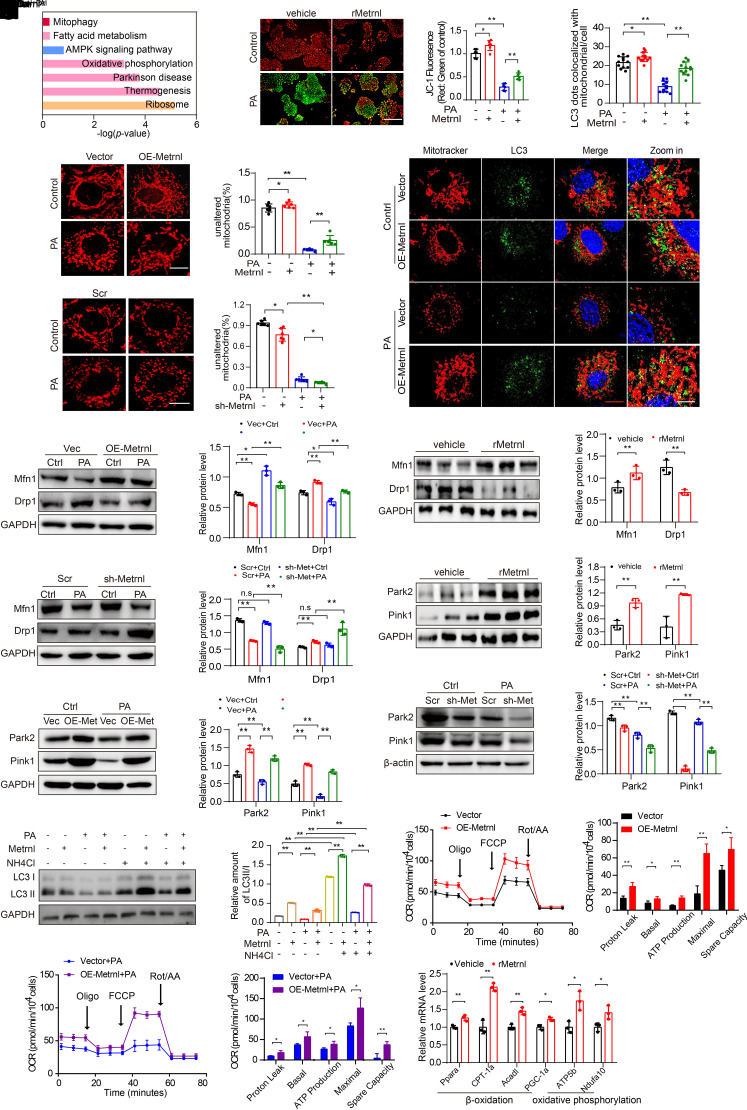
Figure 4.
Changes in Metrnl expression associated with changes in mitochondrial homeostasis. A: Pathway enrichment analysis in PA-treated or PA-treated plus rMetrnl-cultured NRK-52E cells for 48 h, based on RNA-sequencing data (n = 3/group). B: Representative microscopic and quantification images of the mitochondrial membrane potential by JC-1 staining in NRK-52E cells after rMetrnl treatment with PA, cultured for 48 h (n = 6/group). Scale bar, 100 μm. C and D: Representative microscopic images and quantification of the fragmented mitochondria in Metrnl-overexpression (C) and Metrnl-knockdown (D), stable NRK-52E cells by MitoTracker (red) staining with PA, cultured for 48 h (n = 6/group). Scale bar, 5 μm. E: Representative Western blot and quantification images of the mitochondrial fission machinery Drp1 and Mfn1 expression in Metrnl-overexpression NRK-52E cells (n = 3 blots). F: Representative Western blot and quantification images of Drp1 and Mfn1 expression in renal cortex of db/db mice after rMetrnl treatment (n = 3 blots). G: Representative Western blot images and quantification of Drp1 and Mfn1 expression in Metrnl-knockdown, stable NRK-52E cells (n = 3 blots). H: Representative Western blot and quantification of Park2 and Pink1 expression in renal tissue of db/db mice after rMetrnl treatment (n = 3 blots). I and J: Representative Western blot and quantification of Park2 and Pink1 expression in Metrnl-overexpression (I) and Metrnl-knockdown (J) stable NRK-52E cells with PA, cultured for 48 h (n = 3 blots). K: Representative confocal microscopic images and quantification of double immunofluorescence staining for LC3 (green) and MitoTracker (red), markers for autophagosome and mitochondria individually, in Metrnl-overexpression NRK-52E cells with PA cultured for 48 h and DAPI staining for nuclei (n = 12 cells/group). Scale bars: red, 20 μm; white, 5 μm. L: Representative Western blot and quantification of LC3 II/I expression in Metrnl-overexpression NRK-52E cells under lysosomal acidifier NH4Cl (25 mmol/L) stimulation for 48 h (n = 3 blots). M and N: An analysis of oxygen consumption in Metrnl-overexpression NRK-52E cells cultured with PA or not for 48 h. Those cells then were sequentially added to oligomycin (oligo) 1.5 μm), carbonyl cyanide-p-trifluoromethoxyphenylhydrazone (FCCP) (1.0 μm), rotenone/antimycin A (Rot/AA) (0.5 μm) to determine different parameters of mitochondrial functions according to the manufacturer’s instructions (n = 3 per group). Graphical representations of proton leak OCR, basal OCR, ATP production, spare respiration capacity, and maximal OCR. O: Relative mRNA levels of genes related to fatty acid β-oxidation and OXPHOS in renal cortex of db/db mice after rMetrnl treatment (n = 3 per group). Data are reported as mean ± SD. *P < 0.05, **P < 0.01. Ctrl, control; Vec, vector.

