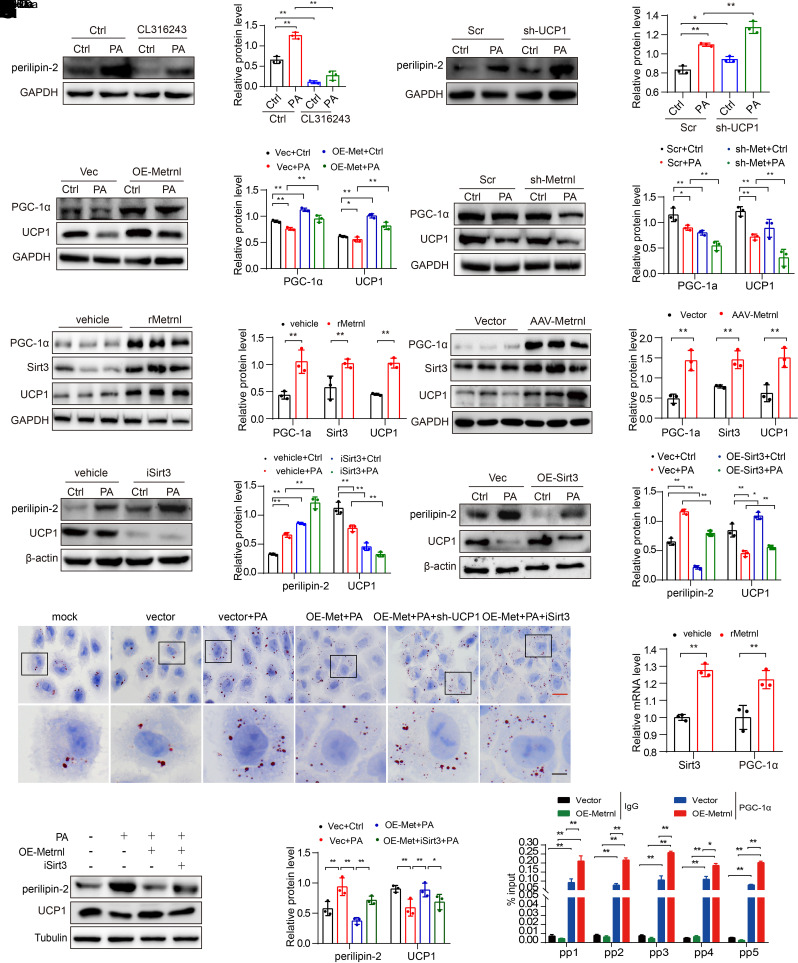
Figure 6.
Metrnl promotes thermogenesis via Sirt3-mediated UCP1 to alleviate lipid accumulation. A and B: Representative Western blot and quantification of the protein levels of perilipin-2 in UCP1 agonist treatment (CL316243; 2 µmol/L) (A) or UCP1 knockdown (sh-UCP1) (B) NRK-52E cells for 48 h in different groups (n = 3 blots). C and D: Representative Western blot and quantification of UCP1 and PGC-1α expression in Metrnl overexpression (C) and Metrnl-knockdown (D) stable NRK-52E cells with PA cultured for 48 h (n = 3 blots). E and F: Representative Western blot and quantification of the protein levels of PGC-1α, UCP1, and Sirt3 in renal tissue of db/db mice after rMetrnl treatment (E) or AAV9-Metrnl overexpression (F) (n = 3 blots). G and H: Representative Western blot and quantification of the UCP1 and perilipin-2 expression in Sirt3 inhibitor (iSirt3)-treated (3-TYP; 2 µmol/L) (G) or Sirt3 overexpression (H) NRK-52E cells under PA stimulation for 48 h (n = 3 blots). I: Representative images of Oil Red O staining in UCP1-knockdown or iSirt3, with rMetrnl-treated NRK-52E cells in different groups. Scale bars: red, 20 μm; black, 5 μm. J: Representative Western blot and quantification of UCP1 and perilipin-2 expression in Metrnl overexpression and with iSirt3-treated (3-TYP; 2 µmol/L) NRK-52E cells under PA stimulation for 48 h (n = 3 blots). K: RT-qPCR analysis of Sirt3 and PGC-1α mRNA levels in rMetrnl-treated db/db mice (n = 3 blots). L: RT-qPCR analysis of Sirt3 mRNA levels with PGC-1α antibody or IgG antibody by ChIP assay in Metrnl-overexpression or control NRK-52E cells (n = 3). Data are reported as mean ± SD. *P < 0.05, **P < 0.01. Ctrl, control; Vec, vector.

