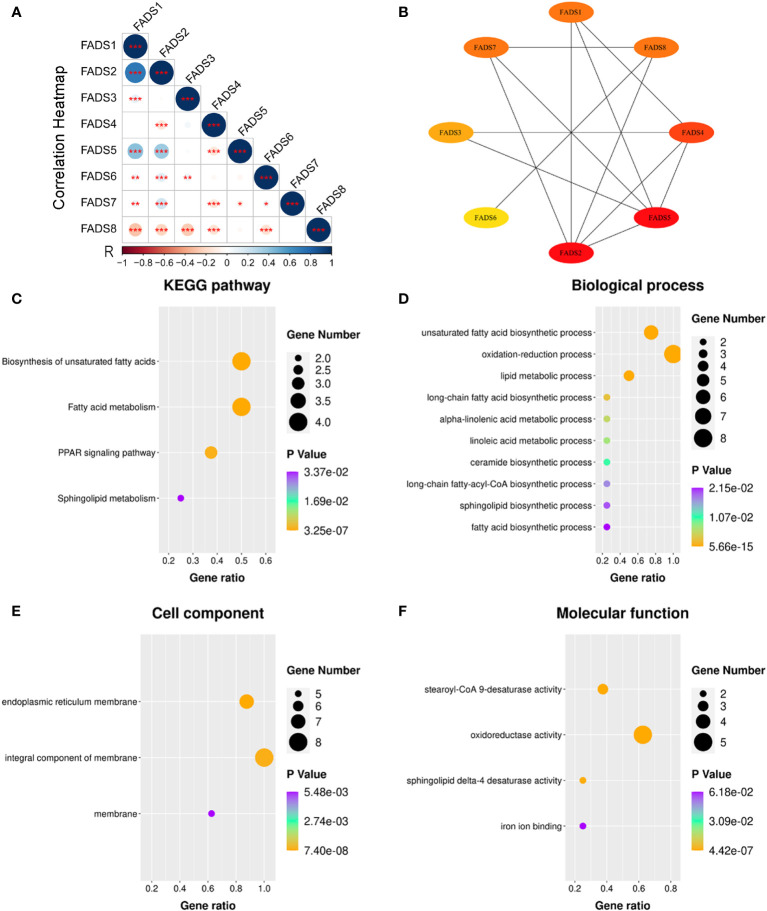
Figure 7.
PPI network and GO and KEGG pathway enrichment analyses for FADSs in BC were conducted using STRING and DAVID, respectively. (A) A heat map showing the correlation of eight FADSs in BC (* P < 0.05, ** P < 0.01, *** P < 0.001). (B) PPI network. (C) KEGG pathway enrichment analysis. (D) Terms enriched in the biological process, (E) cellular component, and (F) molecular function categories in BC.

