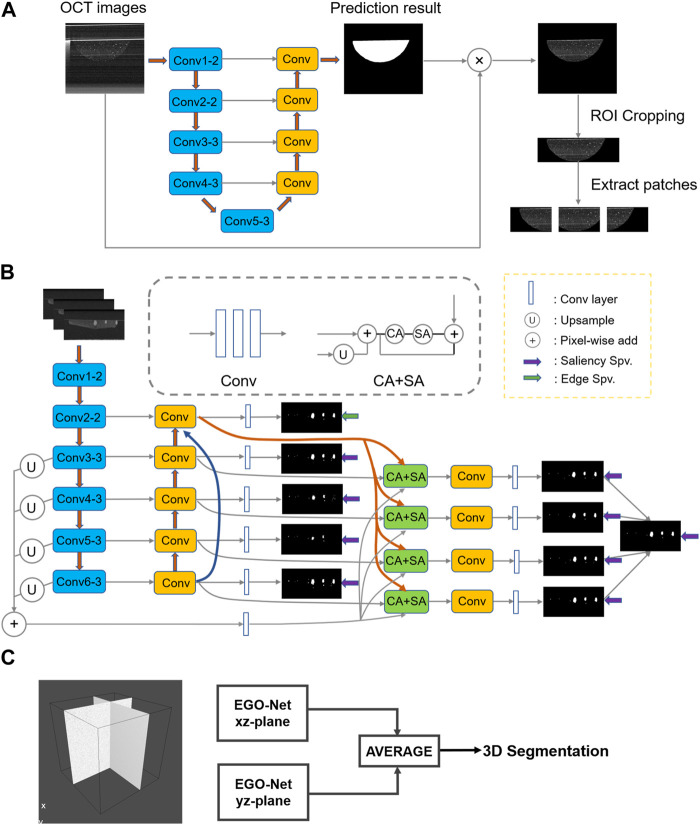
FIGURE 2.
The network structure or method used in the entire segmentation process. (A) Determine the VGG-Unet structure for the region of interest microbeads. (B) Architecture of the proposed EGO-Net. (The left side shows the encoder and decoder combination with U-shaped structure. The encoder receives the image as input and generates multi-level and multi-resolution feature representations, while fusing the features after Conv2-2 to obtain multi-scale features. The decoder then receives the feature representation from the encoder to generate the corresponding predicted output, and uses the output corresponding to Conv2-2 to generate edge features. The segmentation results are obtained on the right side by fusing the multi-scale features, predicted outputs and edge features and decoding them accordingly.) (C) The final 3D segmented image obtained by averaging results of two orthogonal direction.

