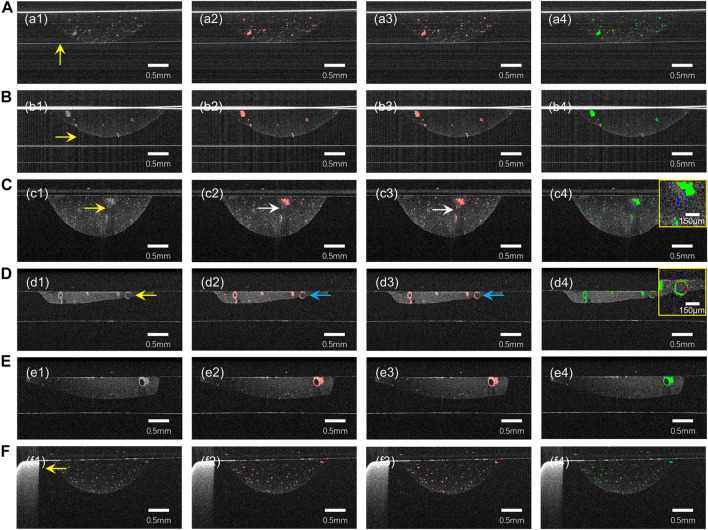
FIGURE 3.
The prediction results of our model for some challenging cases of B-Scan. (A) autocorrelation noise; (B) strong reflection noise; (C,D) low contrast and blurred boundaries; (E) different density and morphology of organoid. (F) Well plates. (a1)–(f1) are OCT images, (a2)–(f2) are ground truth, (a3)–(f3) are neural network prediction results, and (a4)–(f4) are fusion results (green) of ground truth (red) and prediction results (blue). The yellow arrows indicate possible problems in the OCT images. The white arrow in row 3 points out that Matrigel was misclassified as an organoid. The blue arrow in row 4 points out that the organoid was not successfully segmented.

