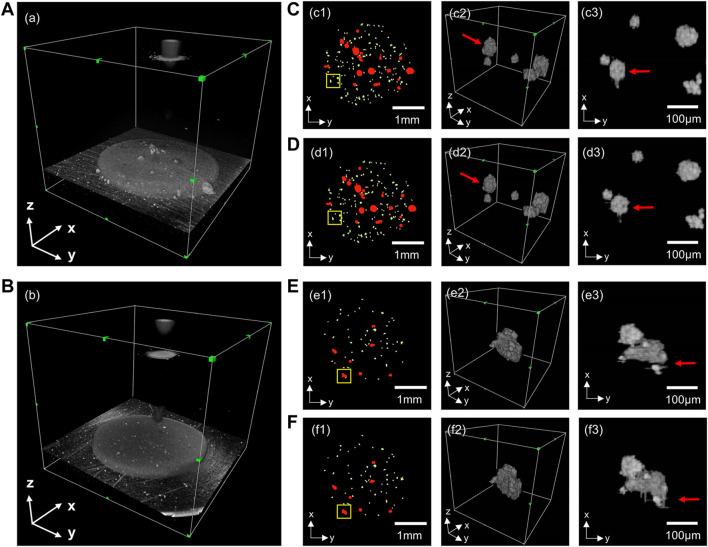
FIGURE 4.
Comparison of the 3D segmentation results of unidirectional prediction and orthogonal continuous input prediction. (A,B) are two sets of 3D OCT examples; (C,E) are 3D segmentations with unidirectional prediction. (D,F) are 3D segmentations with orthogonal continuous input prediction. (c1–f1) are top views of 3D reconstructions of organoids segmentation; (c2–f2) are enlarged 3D reconstructions of the yellow boxes in (c1–f1); (c3–f3) are top views corresponding of (c2–f2).

