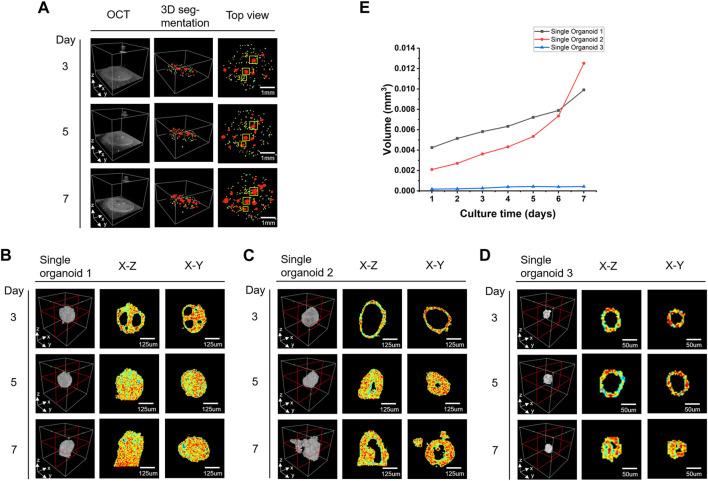
FIGURE 5.
Shape and size changes of colon cancer organoids during the monitoring period. (A) Colon cancer organoids at different time points. From left to right are 3D OCT images, 3D segmentation results and the top views. Different diameters of organoids are marked with different colors (yellow:50 μm > d ≥ 32μm, green: 90 μm > d ≥ 50μm, red: d ≥ 90 μm). (B–D) Enlarged views of the three organoids marked as 1, 2, and 3 by the yellow boxes in (A). (E) The volume growth analysis of three organoids in (B–D) over 7 days.

