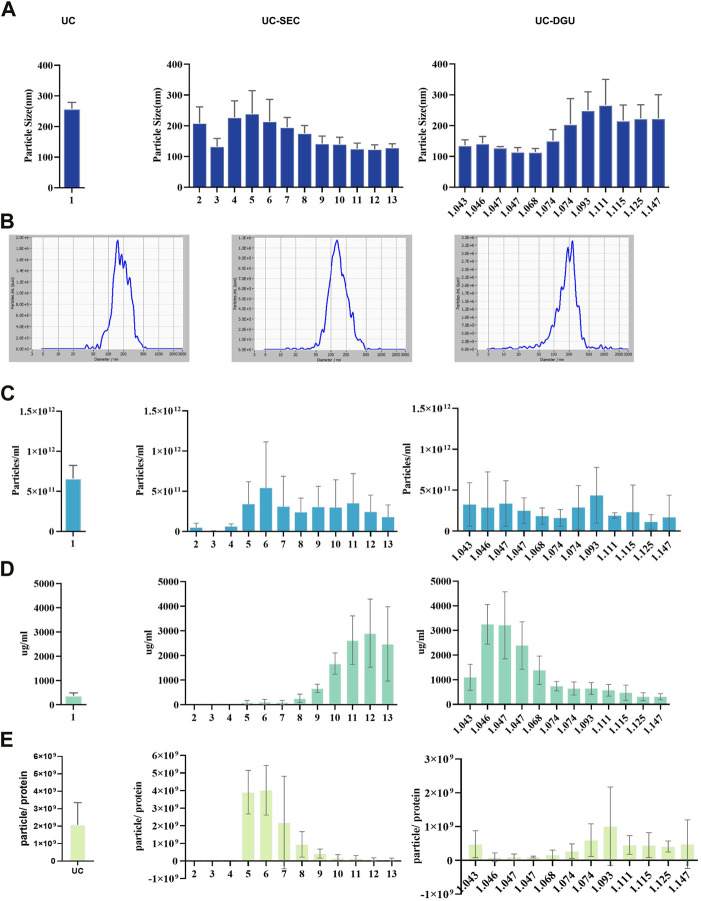
FIGURE 1.
The yield and purity of pEVs. (A) The size distribution of pEVs separated by three methods were measured using nanoparticle tracking analysis (NTA). (B) Representative particle size distribution plots of pEVs separated by three methods were measured using NTA. (C) The concentration of pEVs particles separated by three methods was measured using NTA. (D) The protein concentration of isolated particles by three methods was measured by BCA assay. (E) The particle number/protein (ug) ratio of pEVs for three methods.

