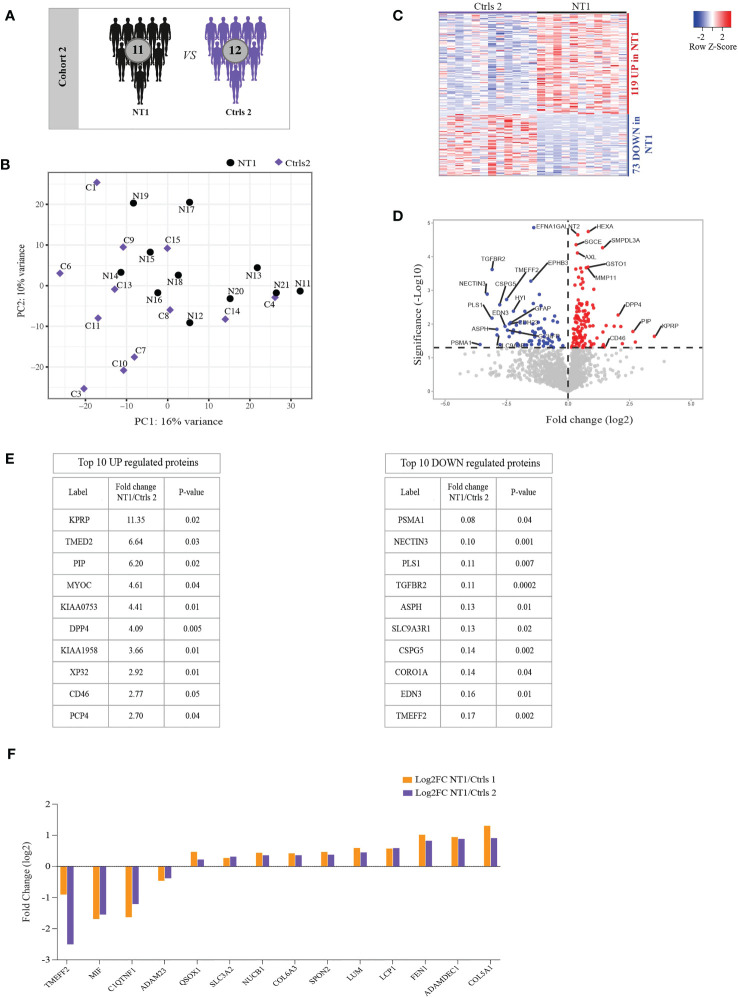
Figure 2.
Differentially regulated proteins in the CSF of persons with NT1 compared to patients with other sleep disorders (OSD) and common proteins between cohorts. (A) In cohort 2, the proteomic analysis of the CSF from 11 NT1 patients was compared to that of 12 patients with OSD. (B) Principal Component Analysis (PCA) visualization of the first two principal components. (C) Heatmap of differentially abundant proteins in the CSF of NT1 patients vs. OSD (p-value<0.05; Limma test). (D) Volcano plot representing the fold change (log2) of each protein in NT1 patients compared to OSD controls and the p value (-Log10), assessed with the Limma test. A significance threshold was set at p ≤ 0.05 (dashed line). (E) The top 10 up-regulated (left) and down-regulated (right) proteins in NT1 patients. (F) Shared congruently differentially regulated proteins between cohort 1 and cohort 2 and their log2 fold change.

