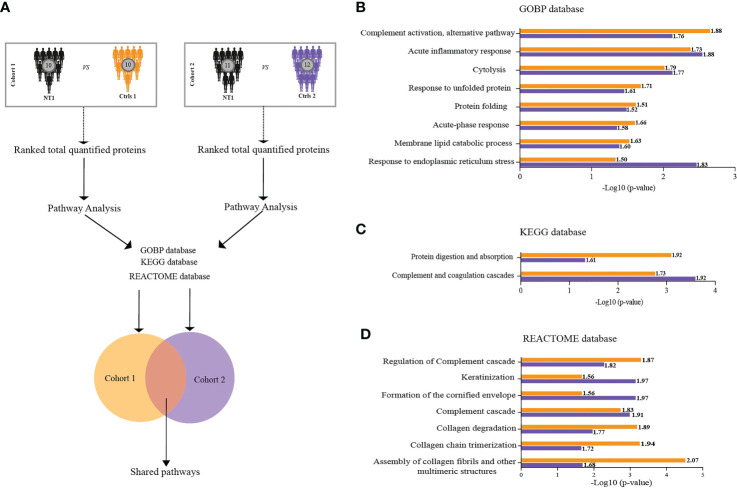
Figure 3.
Biological pathways enriched in the CSF of NT1 patients in both cohort 1 and cohort 2. (A) Scheme of the analytical design: In each cohort separately, total proteins were ranked based on their fold change then pathway analysis was performed using the GSEA feature of Cluster Profiler. Three databases were interrogated (GOBP, KEGG and REACTOME). Only the statistically significant pathways shared between the two cohorts were considered for further analysis. (B–D) Log10 p-values of pathway enrichment in cohort 1 (Orange) and cohort 2 (Purple), in reference to the three databases. Values close to each bar represent the normalized enrichment score (NES), predicting activation or inhibition of a given pathway.

