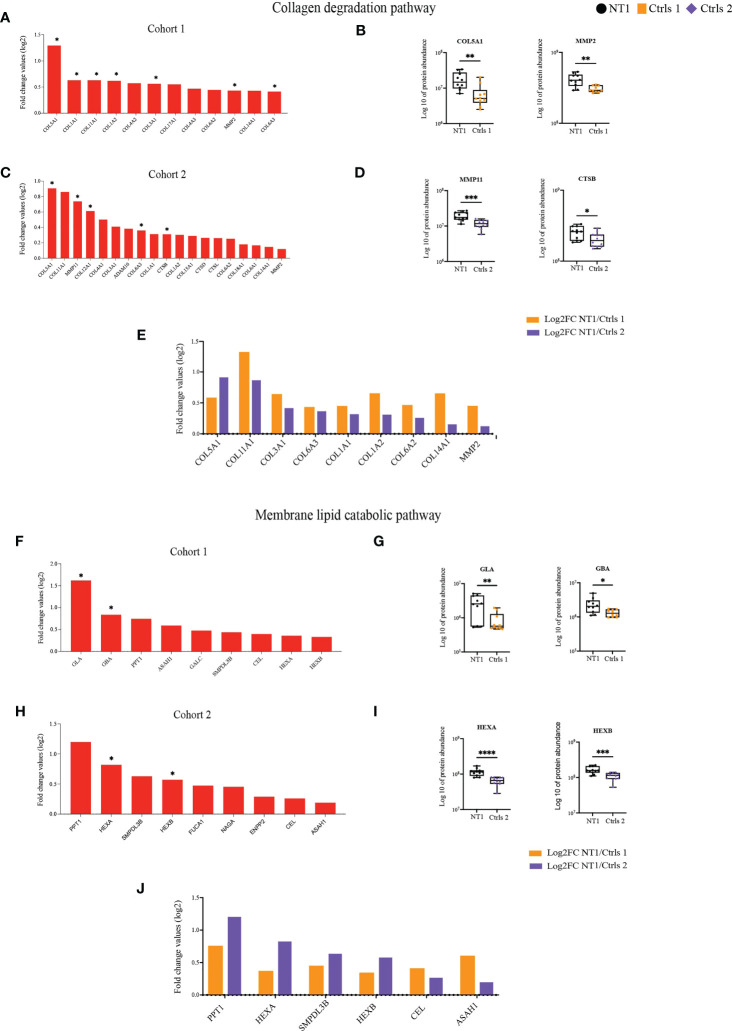
Figure 4.
Increased abundance of proteins involved in collagen and lipid degradation in the CSF of NT1 patients. (A) The proteins involved in the collagen degradation pathway, their log2 fold change ratio in cohort 1 and (B) boxplots of selected proteins. (C) The proteins involved in the collagen degradation pathway, their log2 fold change ratio in cohort 2 and (D) boxplots of selected proteins. (E) Shared collagen degradation proteins between cohort 1 and cohort 2 and their log2 fold change. (F) The proteins involved in the membrane lipid catabolic pathway, their log2 fold change ratio in cohort 1 and (G) boxplots of selected proteins. (H) The proteins involved in the membrane lipid catabolic pathway, their log2 fold change ratio in cohort 2 and (I) boxplots of selected proteins. (J) Shared membrane lipid catabolic proteins between cohort 1 and cohort 2 and their log2 fold change. P-values in (A, C, F, H) are calculated using the Limma test. P-values in (B, D, G, I) are calculated with the Mann-Whitney test. *p-value<0.05, **p-value <0.01, ***p-value<0.001, ****p-value<0.0001.

