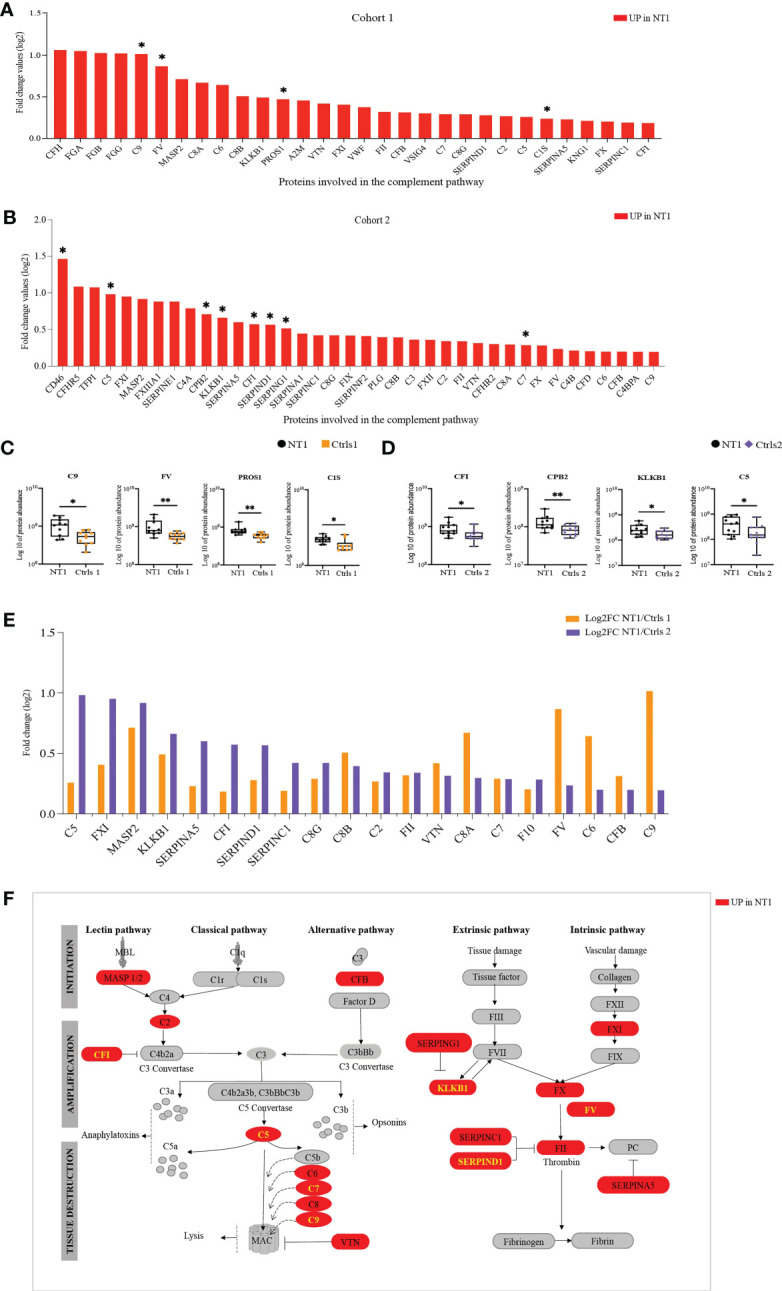
Figure 5.

The complement and coagulation pathway are enriched in NT1 patients. (A) The proteins involved in the complement and coagulation pathway, their log2 fold change ratio in cohort 1. (B) The proteins involved in the complement and coagulation pathway, their log2 fold change ratio in cohort 2. (A, B) The proteins that are significantly regulated in the CSF of NT1 patients are indicated with a star (p-value<0.05; Limma test). (C) Boxplots of the differentially regulated proteins in cohort 1. (D) Boxplots of selected proteins in cohort 2. *p-value<0.05, **p-value <0.01; Mann Whitney test. (E) Complement and coagulation proteins differentially regulated in both cohort 1 and cohort 2 and their log2 fold change. (F) Representation of the complement and coagulation proteins highlighting in red proteins up-regulated in the CSF of NT1 patients from both cohorts.
