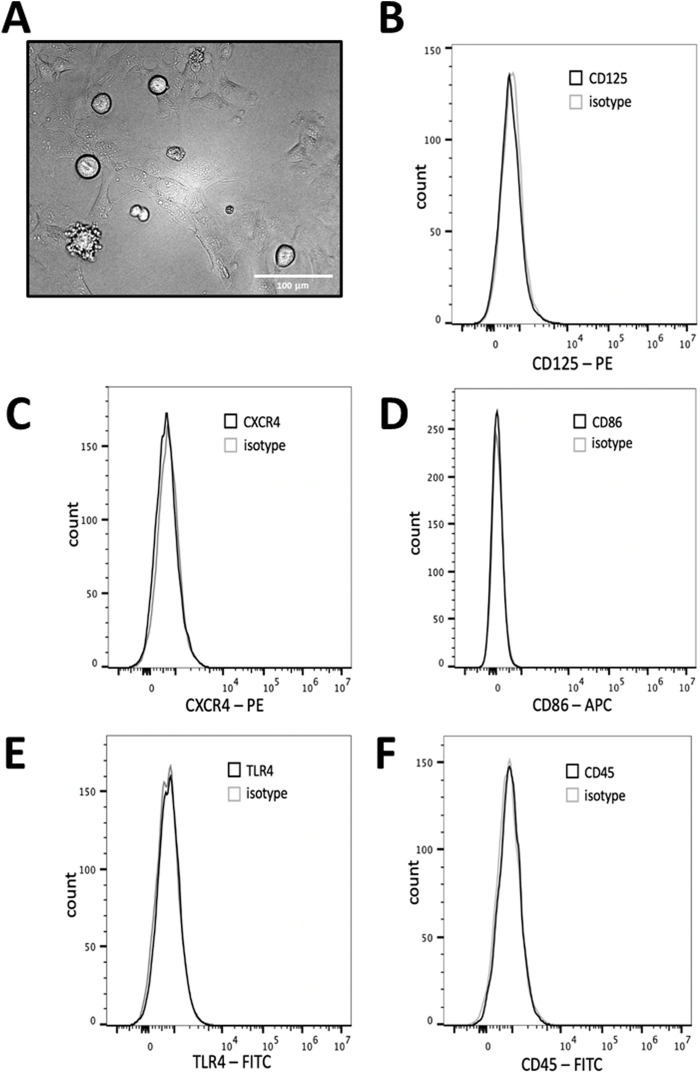
FIGURE 1.
HMC3 cell morphology and biomarker expression. (A) HMC3 imaged via phase contrast microscopy at ×20 magnification. HMC3 were plated and left, unstimulated, for 24 h and analyzed for expression of (B) CD125, (C) CXCR4, (D) CD86, (E) TLR4, or (F) CD45 and analyzed via flow cytometry. Data shown is representative of three independent experiments (n = 3).

