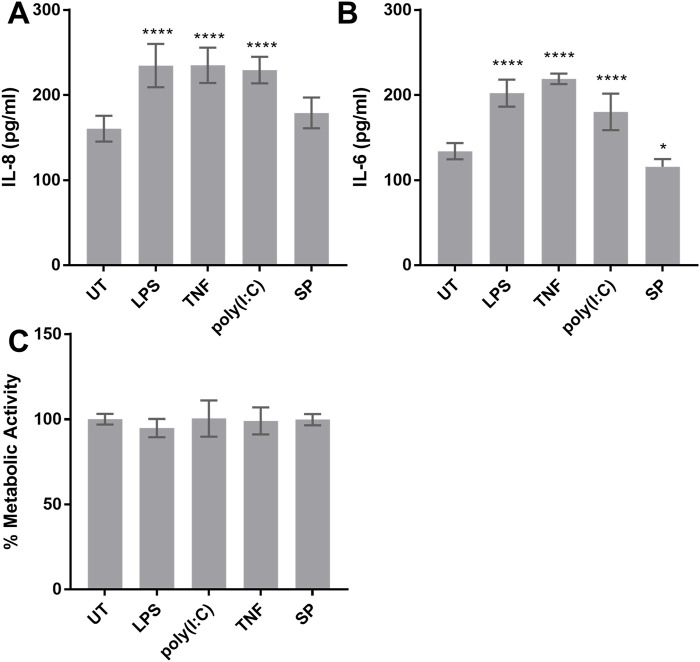
FIGURE 2.
Cytokine release and metabolic activity of HMC3. (A, B) HMC3 were stimulated with 1 µg/mL LPS, 0.25 µg/mL TNF, 0.5 µg/mL poly(I:C), 0.5 µg/mL substance P (SP), or left untreated (UT) for 24 h and IL-8 and IL-6 production was measured by ELISA. (C) HMC3 were activated as in (A) and metabolic activity was determined by reduction of XTT. Data are presented as mean ± SEM for n = 3. Statistical significance was calculated using one-way ANOVA with Dunnett’s multiple comparison pot-hoc analysis relative to untreated (UT): p ≤ 0.05 (*), p ≤ 0.0001 (****).

