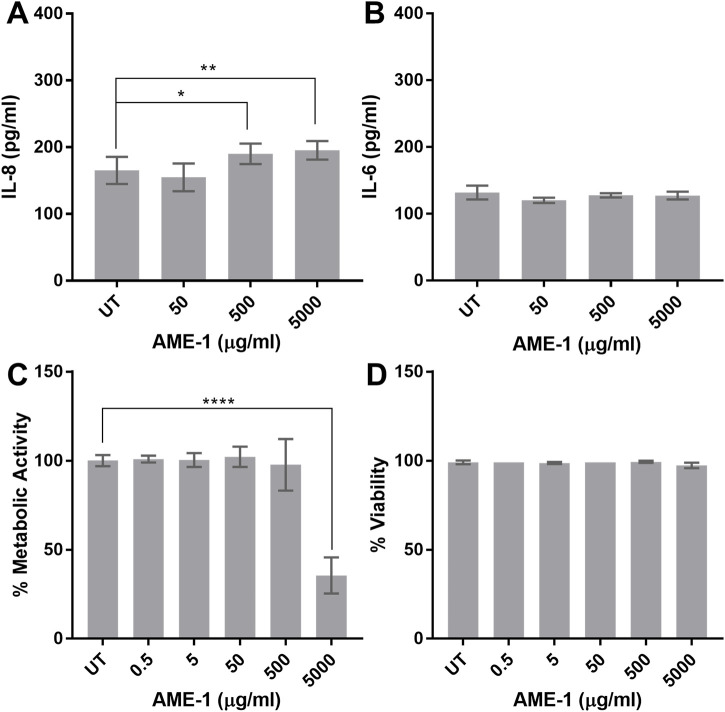
FIGURE 4.
AME-1 effect on IL-8 and IL-6 production and metabolic activity. (A, B) HMC3 were treated with AME-1 (50–5,000 µg/mL) or left untreated (UT) for 24 h and IL-8 and IL-6 production was measured by ELISA. HMC3 were treated as in (A) and metabolic activity and viability was analyzed via (C) XTT and (D) trypan blue exclusion assay. Data presented as mean ± SEM for n = 3. Statistical significance was calculated using one-way ANOVA with Dunnett’s multiple comparison pot-hoc analysis relative to untreated (UT): p ≤ 0.05 (*), p ≤ 0.01 (**), p ≤ 0.0001 (****).

