FIGURE 6.

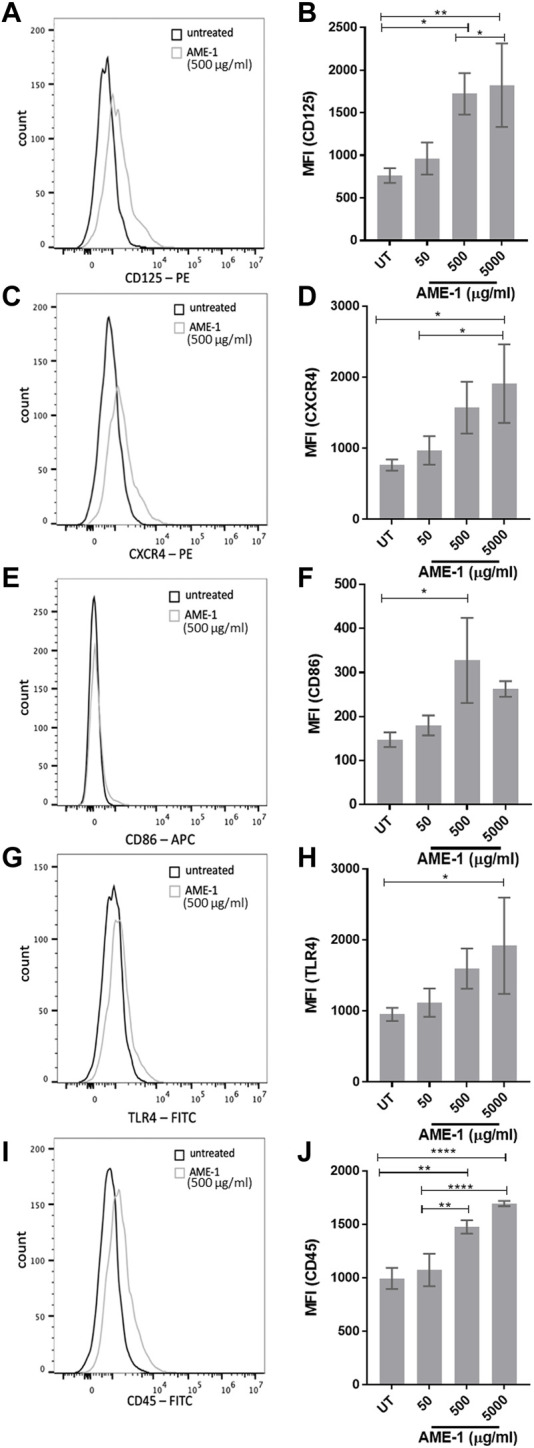
AME-1 significantly increases expression of CD125, CXCR4, CD86, TLR4, and CD45. MFI histograms and corresponding bar graphs of HMC3 treated with 50–5,000 μg/mL of AME-1 for 24 h,labelled with (A, B) PE-CD125, (C, D) PE-CXCR4, (E, F) APCCD86, (G, H) FITC-TLR4 or (I, J) FITC-CD45 and analyzed via flow cytometry. Data shown in flow cytometry histograms is representative of three independent experiments (n = 3). Mean fluorescence intensity (MFI) values for all three experiments are presented as mean ± SEM forn = 3. Statistical significance was calculated using one-way ANOVA with Tukey post hoc analysis, p ≤ 0.05 (*), p ≤ 0.01 (**), p ≤ 0.0001 (****).
