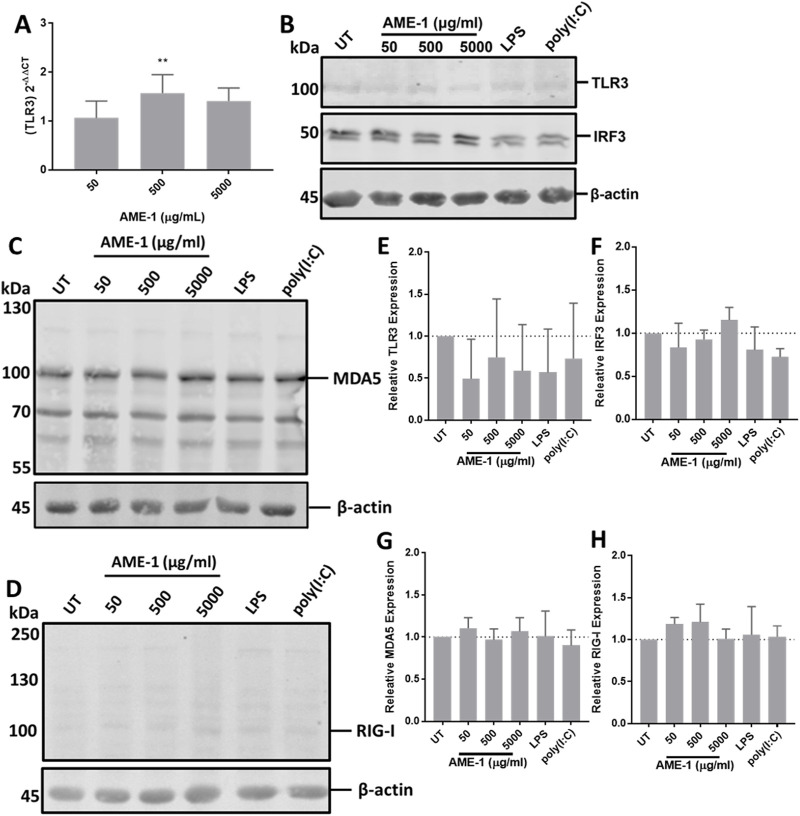
FIGURE 8.
AME-1 upregulates TLR3 expression. (A) HMC3 cells were treated with AME-1 (50–5,000 μg/mL) for 3 h, RNA was extracted and analyzed via RT-qPCR. Results are presented as fold-gene expression relative to untreated cells and statistics were calculated using One-Way ANOVA with Dunnett’s multiple comparison post hoc analysis relative to fold-change in GAPDH expression: p ≤ 0.01 (**). Data presented as mean ± SEM for n = 3. HMC3 were treated with AME-1 (50–5,000 µg/mL), LPS (1 µg/m) or poly(I:C) (0.5 µg/mL) for 24 h, the cells were lysed and analyzed via Western blot. (B) TLR3 and IRF3 protein expression and (E, F) corresponding densitometry analysis. (C, D) MDA5 and RIG-I protein expression and (G, H) corresponding densitometry analysis. Densitometry analysis was performed on three blots on the indicated bands and statistical significance was calculated using one-way ANOVA with Tukey post hoc analysis.

