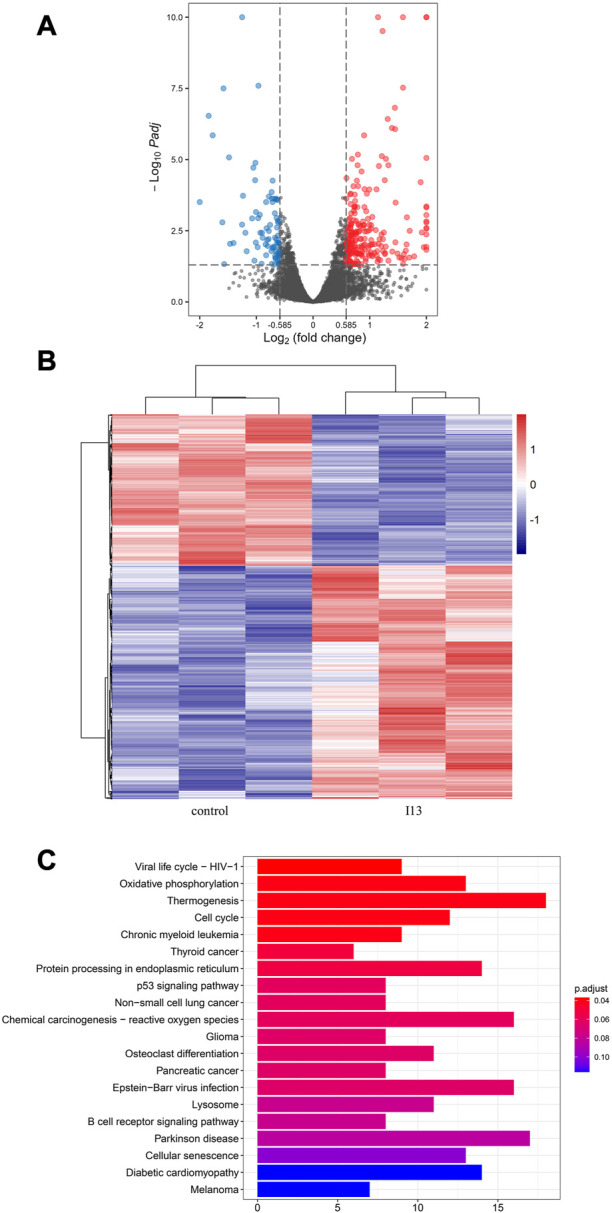
FIGURE 6.

mRNA sequencing analysis in BaF3-T315I cells exposed to I13. (A) Volcano plots of differentially expressed genes. (B) The cluster heatmap of differentially expressed genes. (C) KEGG pathway analysis of DEGs. BaF3-T315I cells were stimulated with I13 at 1.1 µM for 48 h.
