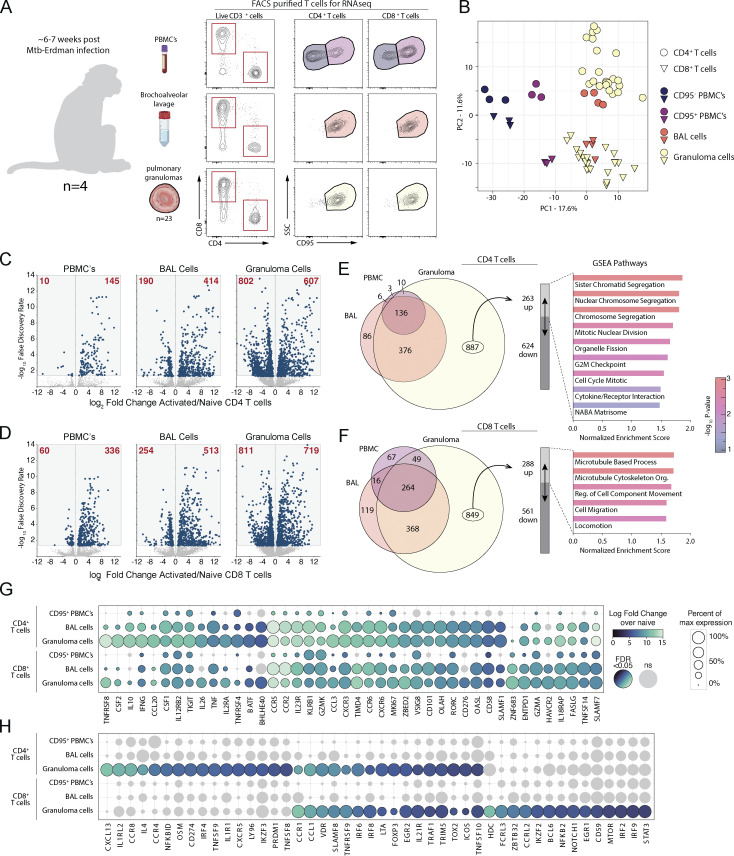
Figure 1.
Gene expression pattern in rhesus macaque Mtb granuloma T cells. (A) Study schematic showing CD4 and CD8 T cells FACS-purified from blood, BAL, and 23 pulmonary granulomas isolated from four rhesus macaques infected with a low dose of Mtb for subsequent transcriptomic analysis. (B) Principal component analysis of the top 7,000 genes expressed. (C and D) Log2 fold change of gene expression of activated over naive T cells from (C) CD4 and (D) CD8 T cells with number of genes indicated in red. (E and F) Proportional Venn diagrams of significant genes differentially regulated from the three tissue compartments with GSEA of the upregulated genes specific only to granulomas from (E) CD4 and (F) CD8 T cells. (G and H) Curated list of genes demonstrated as relative percent expression with indicated significant fold change shown by color to demonstrate genes (G) upregulated in activated T cells compared to (H) genes significantly upregulated only in T cells isolated from granulomas.

