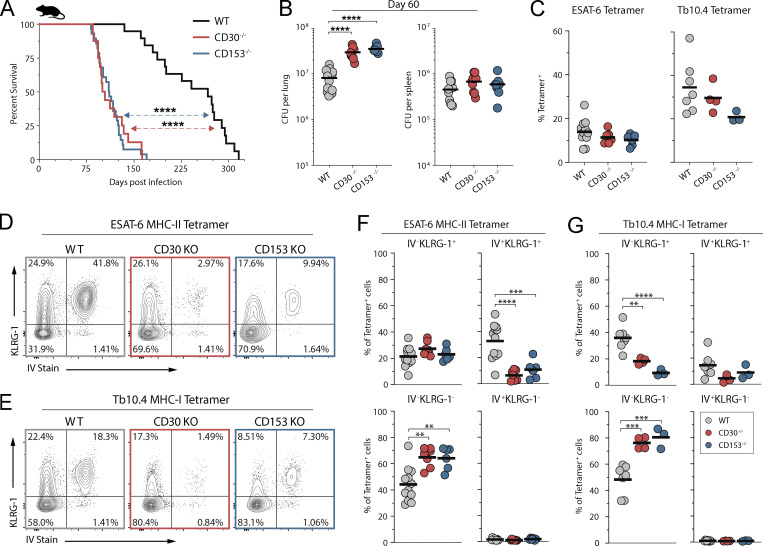
Figure 3.
CD30-deficient mice are susceptible to Mtb infection. (A) Survival curve of intact knockout mice after aerosol infection with ∼100 CFU of Mtb (n = 16–28 per group, three independent experiments shown together). (B) Bacterial burden in the lungs and spleens of mice on day 60 after infection (n = 10–12 per group). (C) Frequency of live CD4+CD44+ T cells that are ESAT-6 tetramer+ or live CD8+CD44+ T cells that are Tb10.4 tetramer+. (D and E) Example flow cytometry plots of T cells showing iv stain and expression of KLRG-1 in (D) ESAT-6 tetramer+ CD4 T cells and (E) Tb10.4 tetramer+ CD8 T cells. (F and G) Frequency of (F) ESAT-6 tetramer+ CD4 T cells and (G) Tb10.4 tetramer+ CD8 T cells expressing KLRG-1 within the vasculature versus parenchyma; (C–G) two independent experiments shown together with n = 3–12 per group. Statistical analysis was calculated by (A) Kaplan–Meier survival curve with log-rank test or (B, C, F, and G) one-way ANOVA with Tukey correction for multiple comparisons. **, P < 0.01; ***, P < 0.001; ****, P < 0.0001.

