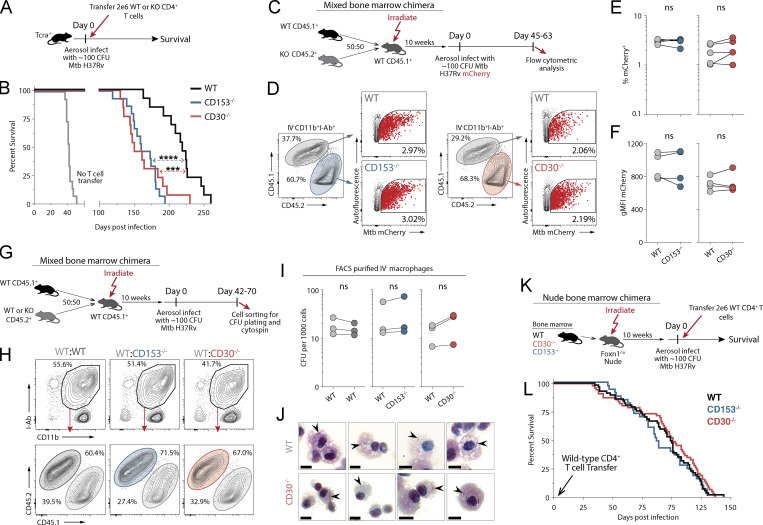
Figure 4.
T cells require CD30 to mediate protection against Mtb infection in mice. (A and B) Experiment schematic for CD4 T cell adoptive transfer (A) and the survival curve of Tcra−/− mice who received WT, CD30−/−, or CD153−/− CD4 T cells at the time of infection (B). Data represent three independent experiments with n = 4–5 per group per experiment. (C) Experiment schematic for MBMC mice to study the intrinsic roles of CD30 and CD153. (D) Example flow cytometry plots of live IV−CD11b+I-Ab+ macrophages from mice infected with mCherry-reporter Mtb. (E and F) Frequency of (E) and gMFI of (F) mCherry+ macrophages in MBMC mice in WT:CD30−/− and WT:CD153−/− chimeras. Data shown are representative of three independent experiments with n = 4–5 per group. (G) Experiment schematic for MBMC mice to study bacterial burdens on a per cell basis. (H) Example flow cytometry plots of live IV−CD11b+I-Ab+ macrophages FACS-sorted for CFU plating. (I) Quantification of the number of bacteria per 1,000 macrophages. Each point represents four to five mice pooled per group showing three independent experiments. (J) FACS-purified macrophages from MBMC mice were cytospin-mounted for subsequent acid-fast bacilli staining, demonstrating no increase in bacterial levels per cell. Arrowheads point to bacilli. Scale bars represent 5 μm. (K and L) Experiment schematic (K) for bone marrow reconstitution of athymic nude mice with subsequent CD4 T cell adoptive transfer at the time of infection with the (L) survival curve of mice where all hematopoietic cells except CD4 T cells are from WT, CD30−/−, or CD153−/− bone marrow donors. Data are representative of six independent experiments with n = 3–14 mice per group per experiment, for a total of 33–55 mice per group. Statistical analysis was calculated by (B and L) Kaplan–Meier survival curve with log-rank test or (E, F, and L) paired t tests. ***, P < 0.001; ****, P < 0.0001

