Figure 5.
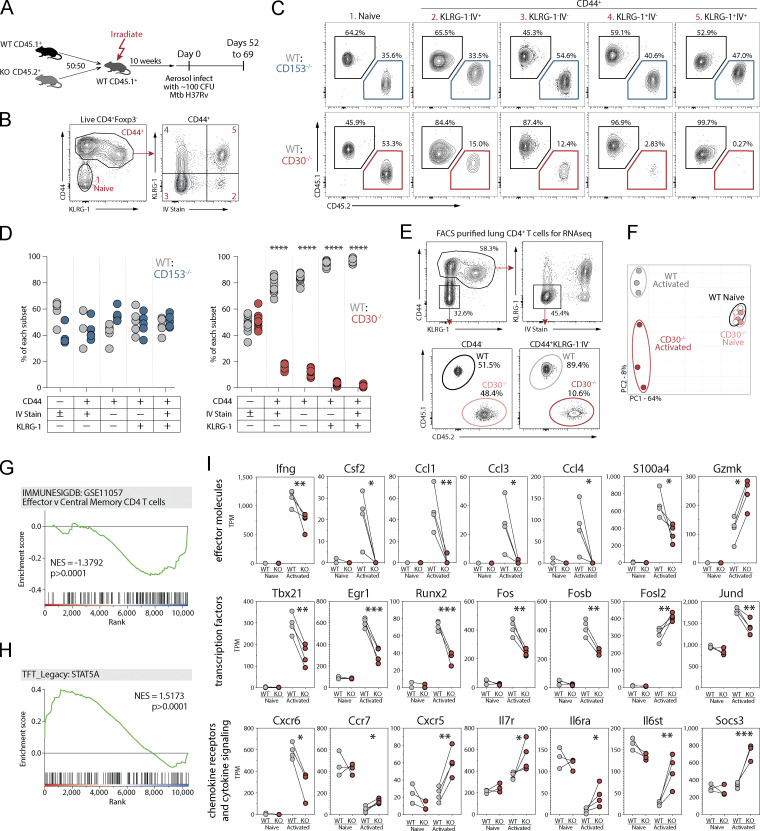
CD30 signaling drives CD4 T cell differentiation and effector molecule expression during Mtb infection. (A) Experiment schematic showing MBMC mice to study the T cell–intrinsic roles of CD30 and CD153 in responses to Mtb infection. (B and C) Example flow cytometry plots and gating of CD4 T cell populations for analysis comparing WT:KO ratios within each of these populations. (D) Frequency of WT:CD153−/− and WT:CD30−/− cells within each of these T cell populations. Data shown are representative of four independent experiments with n = 4–10 mice per group per experiment. (E) Example flow cytometry plots for FACS purification of live IV−KLRG-1− CD44+CD4+ or CD44−CD4+ T cells for gene expression profiling. (F) Principal component analysis of the top 3,000 genes expressed in these populations from WT or CD30−/− CD4 T cells. Data shown are representative of three independent experiments with n = 5 mice per experiment pooled after FACS sorting. (G and H) GSEA of genes differentially expressed between WT and KO activated T cells in comparison to two gene sets showing WT cells highly enriched for STAT5a signaling, while KO cells are enriched for less effector-like gene expression. (I) Manually curated gene sets of CD30-regulated T cell effector molecules, transcription factors, chemokine receptors, and cytokine signaling molecules. Statistical analysis was calculated by (D) multiple t tests per row or (I) t tests. *, P < 0.05; **, P < 0.01; ***, P < 0.001; ****, P < 0.0001.

