Figure 1.
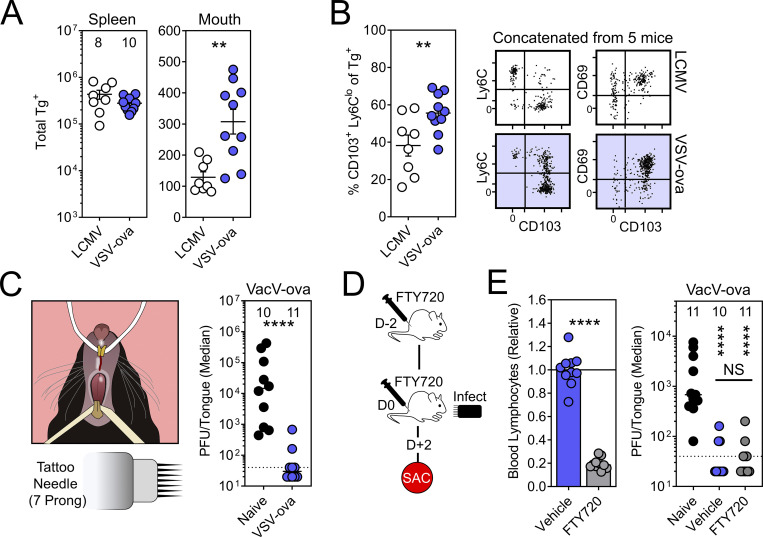
TRM-phenotype cells populate the oral mucosa following systemic viral infections and contribute to local immunity. (A) Mice received 5 × 10⁴ congenically labeled P14 or OT-I T cells 1 d prior to systemic infection with LCMV-Arm or VSV-ova. Enumeration of Tg+ T cells in spleen (left) and oral tissue (right). Numbers above bars indicate replicates per group from two independent experiments. (B) Phenotype of Tg+ T cells in the oral mucosa following systemic LCMV-Arm or VSV-ova infection. Flow cytometry plots are concatenated from five mice from one of two independent experiments (gated on intravascular-staining negative Tg+ CD8+ T cells). (C) Left: Cartoon of mouse restraint for lingual infections. Right: Tongue viral titers 48 h after infection of the ventral lingual mucosa with VacV-ova in naive (black) vs. VSV-ova memory mice (blue). Dotted line represents limit of detection (40 PFU/tongue). (D) Experimental strategy and time course. Mice received two doses of FTY720 or vehicle control and were sacrificed (SAC) 48 h after lingual challenge with VacV-ova. (E) Left: Relative lymphocyte abundance in blood 48 h after treatment with vehicle control or FTY720. Right: VacV-ova viral titers in tongues of naive (black) or VSV-ova memory mice treated with either vehicle control (blue) or FTY720 (gray). Numbers indicate replicates per group from two independent experiments (N ≥ 4 mice/group/experiment). Error bars in A and B represent mean ± SEM. Data in C and D show median. All dots represent individual mice. **, P < 0.01; ****, P < 0.0001 as determined by an unpaired Student’s t test (A, B, and E; left) with an additional Mann–Whitney test (C) or Kruskal–Wallis multi-comparison test (E; right).

