Figure 2.
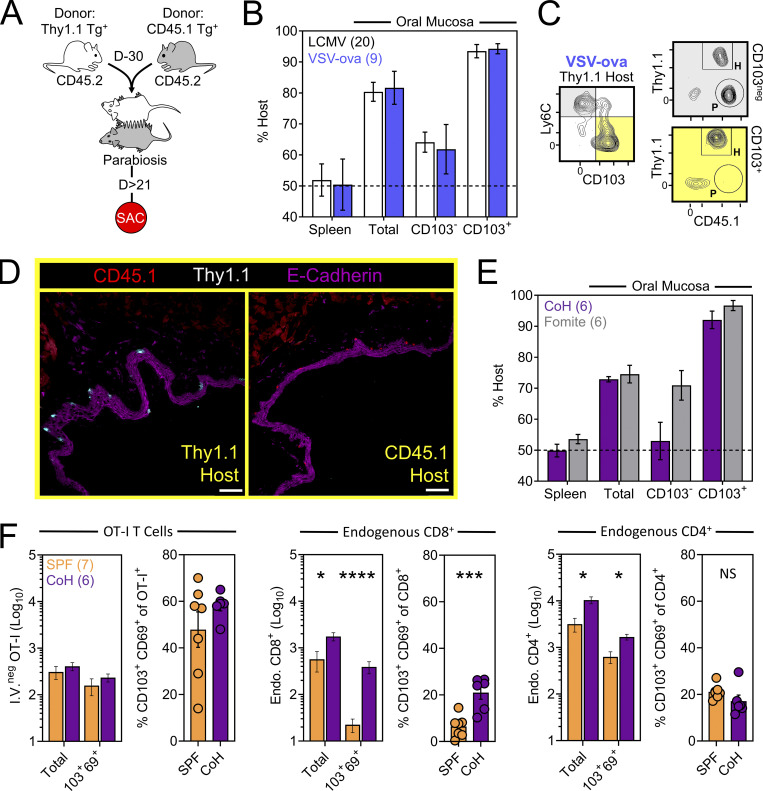
CD103+ memory CD8+ T cells in the oral mucosa are TRM. (A) Parabiosis strategy to determine the degree by which Tg+ T cells in the oral mucosa following systemic viral infections are resident. (B) Percent host among P14 T cells and OT-I T cells in the spleen and oral mucosa (comparing CD103neg vs. CD103+ subsets) following systemic LCMV-Arm (white) or VSV-ova (blue) infection. Numbers indicate parabiotic mice per group from at least two independent experiments. (C) Representative flow cytometry highlighting host vs. partner OT-I T cells among CD103neg Ly6Chi and CD103+ Ly6Clo CD8+ T cells within the oral mucosa of a Thy1.1+ VSV-ova immune parabiont. H = Host-derived cells, P = Partner-derived cells. (D) Representative histology of the ventral lingual mucosa from VSV-ova immune parabionts. Scale bar represents 75 µm. (E) Percent host among endogenous CD8+ T cells within spleen and oral mucosa (comparing CD103neg vs. CD103+ subsets) of parabiotic mice cohoused (purple; CoH) or exposed to the soiled bedding (gray; fomite) of pet shop mice for >60 d prior to surgery. Numbers represent individual parabiotic mice per group from cohoused or fomite-exposed parabiont cohorts analyzed on sperate days. (F) Left: Total i.v.neg OT-I T cells (left) and percentage of CD103+ CD69+ OT-I T cells isolated from the oral mucosa of VSV-ova immune mice housed under SPF conditions (orange) or cohoused with pet shop mice (purple) for >60 d. Middle: Enumeration of endogenous and TRM-phenotype CD8+ T cells in SPF vs. cohoused mice. Right: Enumeration of endogenous and TRM-phenotype CD4+ T cells in SPF vs. cohoused mice. Numbers in F indicate replicates per group from two independent experiments. In all graphs, error bars represent mean ± SEM. All dots represent individual mice. *, P < 0.05; ***, P < 0.001; ****, P < 0.0001 as determined by an unpaired Student’s t test between the relevant comparisons.

