Figure 3.
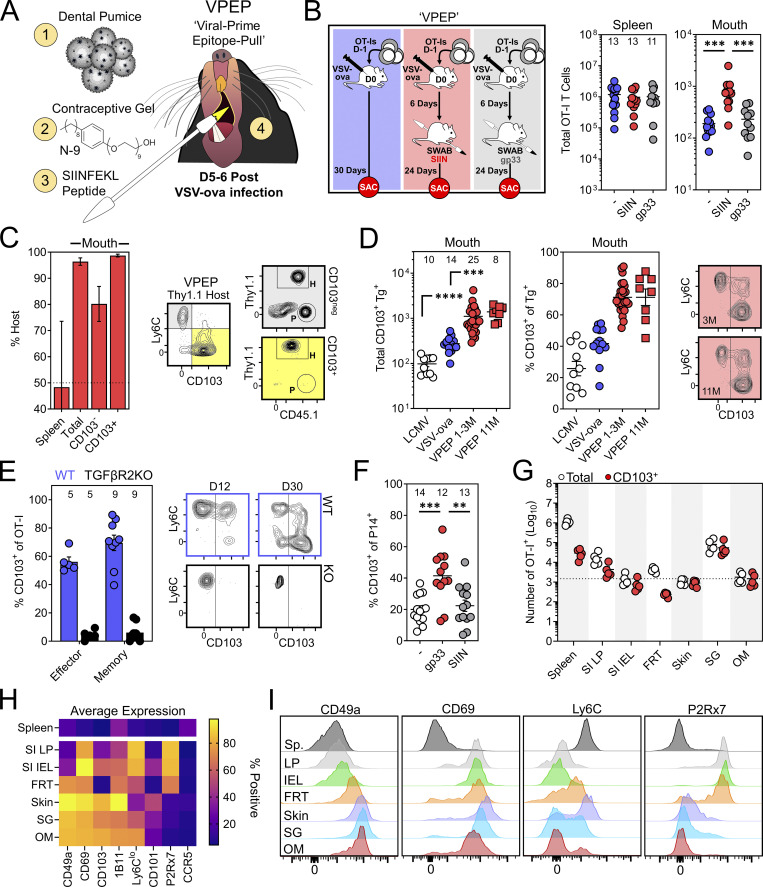
A VPEP strategy generates preternaturally abundant oral TRM. (A) VPEP approach. The oral surfaces are swabbed with SIIN peptide dissolved in fine dental pumice and contraceptive gel containing N-9. (B) Quantification of OT-I T cells in spleens and oral mucosa of mice given systemic VSV-ova alone (blue), VPEP (red; SIIN), or VPEP with irrelevant gp33 peptide (gray; gp33). Numbers above bars indicate replicates per group from three independent experiments (N ≥ 3 mice per group). (C) Percent host OT-I T cells in spleens and oral mucosa of VPEP parabionts 21 d after surgery (left). Right: Representative flow cytometry of CD8+ T cells isolated from the oral mucosa of a Thy1.1+ VPEP parabiont. Data represent two pairs of VPEP parabionts. (D) Enumeration (left) and percent CD103+ of Tg+ T cells (middle) in the oral mucosa in mice 1 mo after infection with systemic LCMV-Arm (white), systemic VSV-ova alone (blue), given VPEP (red circles), or given VPEP and aged an additional 10 mo (red squares). Right: Representative flow cytometry of oral OT-I T cells from VPEP mice infected 3 or 11 mo prior. (E) Left: Percentage of WT and TGFβRII−/− OT-I T cells expressing CD103 in the oral mucosa 4 and 24 d after VPEP (10 or 30 d after VSV-ova infection). Numbers indicate replicates per group from the two timepoints analyzed. Right: Representative flow cytometry plots. (F) Mice were infected with LCMV-Arm ± oral swabbing with relevant (gp33) or irrelevant (SIIN) peptide. Percentage of P14 T cells expressing CD103 is plotted. Numbers indicate replicates per group from three independent experiments (N ≥ 3 mice per group). (G) Enumeration of total i.v.neg OT-I T cells and CD103+ OT-I T cells from the indicated locations. Hashed line denotes the average number of CD103+ OT-I T cells isolated from the oral mucosa. Data are representative of five VPEP memory mice. SI LP, small intestine lamina propria; SI IEL, small intestine intraepithelial compartment; FRT, female reproductive tract; SG, salivary glands; OM, oral mucosa. (H) Heatmap showing expression patterns of several canonical TRM markers among total i.v.neg OT-I T cells isolated from the indicated tissues. (I) Representative histograms showing expression patterns of CD49a, CD69, Ly6C, and P2Rx7 among OT-I T cells isolated from the indicated tissues. In all graphs, error bars represent mean ± SEM. All dots represent individual mice. **, P < 0.01; ***, P < 0.001; ****, P < 0.0001 as determined by an unpaired Student’s t test between the relevant comparisons.

