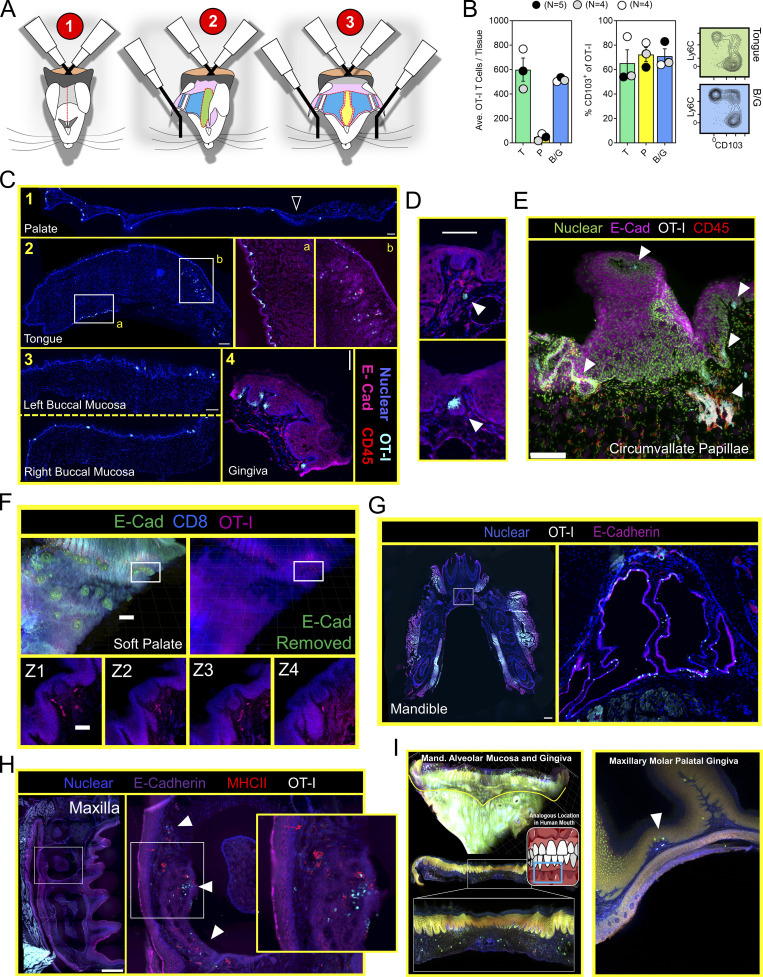
Figure 4.
Mouth TRM are broadly distributed and associated with taste buds. (A) Stepwise process for isolating murine oral tissues including tongue (T; green), palate (P; yellow), and buccal mucosa/gingiva (BM/G; blue). Lateral ovoid shapes in 1 represent the masseter muscles. (B) Individual oral tissues from N ≥ 4 VPEP mice pooled by tissue type into a single sample for flow cytometric analysis. Left: Average number of OT-I T cells recovered from the indicated tissue. Right: Percentage of OT-I T cells expressing CD103, and representative flow cytometry highlighting tongue and buccal mucosa. Data from three independent experiments are shown. (C) IF microscopy of (1) hard and soft palate, (2) tongue, (3) left and right buccal mucosa, and (4) gingiva from VPEP memory mice >90 d after infection. All scale bars represent 200 µm, except in 2 (tongue) where the scale bar represents 500 µm. (D) OT-I T cells associated with taste buds in the soft palate. Two separate examples are shown with scale bar representing 100 µm. Colors reflect staining panel in C. (E) IF microscopy of the circumvallate papillae. Scale bar denotes 100 µm. Arrowheads reflect location of OT-I T cells in VPEP memory mice. (F) Ce3D imaging of the soft palate showing OT-I T cells in close proximity to taste buds directly posterior to the eighth palatine ridge. Scale bar in top left panel depicts 200 µm and scale bar in Z-stacks represent 50 µm. (G) IF image of a whole decalcified mandible from a mouse that received VPEP >30 d prior. Inset highlights OT-I T cells within Wharton’s (submandibular) duct. Lingual muscles intentionally obscured to better visualize periodontium and salivary ducts. Scale bar represents 500 µm. (H) OT-I T cells within maxillary gingiva of VPEP memory mouse, with corresponding magnified images highlighting gingiva surrounding the maxillary second molar. Scale bars in left panel represent 500 µm. Arrowheads denote clusters of OT-I T cells. (I) Ce3D imaging of mandibular (left) and maxillary (right) gingiva showing the presence of OT-I T cells (green) established through VPEP. Analogous location in human mouth shown for mandibular gingiva example. Yellow line denotes mucogingival junction. Arrowhead denotes location of OT-I T cells. All images are representative of at least three histological sections, per indicated tissue location, per mouse, of three or more individual VPEP mice. Taste buds in D and F were identified based on location and crescent morphology.

