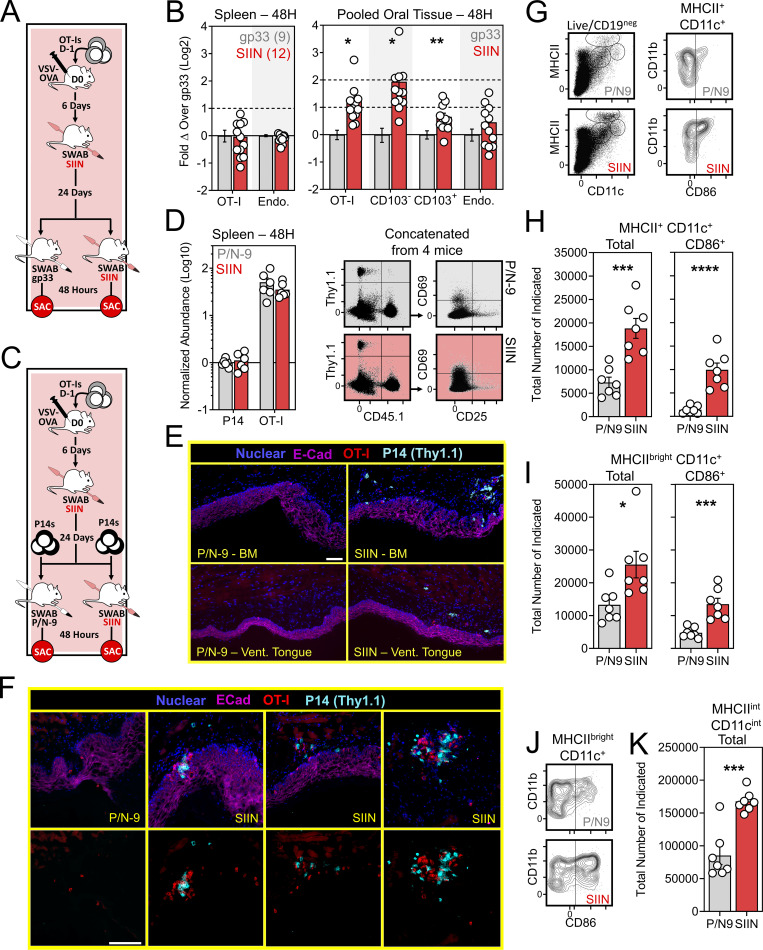
Figure 5.
Oral T cell antigen sensing bolsters cellular immunity in the mouth. (A) Experimental design. (B) Relative abundance of OT-I T cells and endogenous CD8+ T cells in spleens and oral mucosa of VPEP memory mice orally swabbed with gp33 (gray) or SIIN (red) 48 h earlier. Data represent fold change over the indicated phenotype in gp33 swabbed mice. Numbers indicate replicates per group from two independent experiments with ≥4 mice per group. (C) Experimental strategy to assess the ability of oral T cell reactivation to recruit circulating memory T cells into the oral mucosa. (D) Comparison of transferred P14 T cells and OT-I T cells abundance and phenotype in spleens of gp33- or SIIN-swabbed mice 48 h later. Concatenated flow cytometry plots are shown from one of two independent experiments (right). (E) IF imaging of buccal mucosa (top) and ventral lingual mucosa (bottom) from mice orally swabbed 48 h prior with P/N-9 or SIIN in irritants. (F) Higher magnification images of buccal mucosa 48 h after swabbing with P/N-9 or SIIN peptide. Nuclear and E-Cadherin staining removed from bottom panels to better visualize T cell aggregates. Images in E and F are representative of at least three sections, per tissue, per mouse, of six individual mice per group over two independent experiments. (G) Representative flow cytometry plots showing MHCII- and CD11c-expressing subsets in the cLNs of VPEP memory mice exposed 48 h prior to oral swabbing with P/N-9 or P/N-9 containing SIIN (left). CD86 expression among MHCII+ CD11c+ cLN DCs following the indicated treatment (right). (H) Quantification of total MHCII+ CD11c+ DCs (left) and those expressing CD86 (right). (I) Quantification of total MHCbright CD11c+ DCs (left) and those expressing CD86 (right). (J) Representative flow cytometry showing CD86 upregulation on cLN MHCIIbright CD11c+ DCs following the indicated treatment. (K) Enumeration of cLN macrophages (MHCIIint CD11cint) 48 h after oral swabbing with P/N-9 or P/N-9 containing SIIN. Data in G–K are representative of two independent experiments. Scale bars in E and F represents 100 µm. Dots in B, D, H, I, and K represent individual mice. *, P < 0.05; **, P < 0.01; ***, P < 0.001; ****, P < 0.0001 as determined by an unpaired Student’s t test between the relevant comparisons.

