Figure 6.
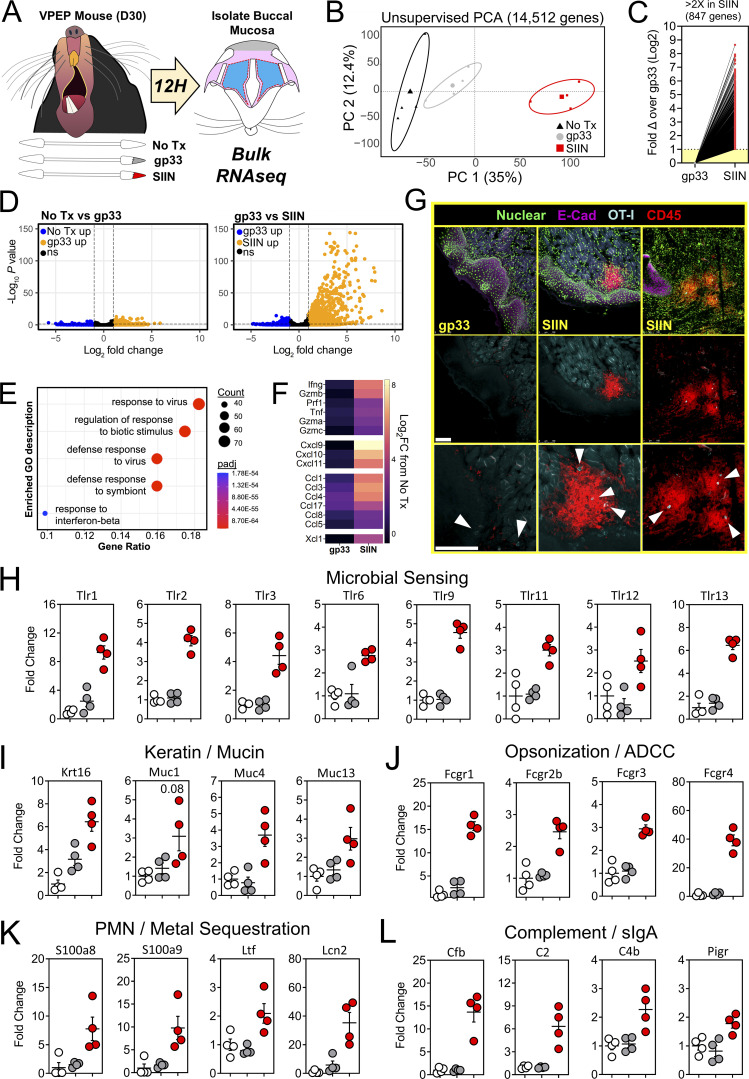
Oral TRM peptide reactivation triggers an oral inflammatory and antimicrobial state. (A) Buccal mucosa mRNA was isolated from untreated VPEP memory mice, or 12 h after swabbing with gp33 or SIIN peptide. (B) Unsupervised PCA plots showing clustering of No Tx (black), gp33 (gray), and SIIN (red) treatment groups. (C) Fold change of all significantly upregulated DEGs. (D) Volcano plots highlighting DEGs that are significantly (FDR P value <0.05) upregulated (>1log2 fold change; orange) or downregulated (<1log2 fold change; blue) between No Tx vs. gp33 (left) and gp33 vs. SIIN (right) treatment groups. N = 4 mice per group. (E) Gene Ontogeny (GO) enrichment analysis for genes upregulated (FDR P value <0.05) in SIIN- compared to gp33-treated buccal mucosa. (F) Log2 fold change (FC) of T cell effector molecule and chemokine genes comparing either gp33- or SIIN-swabbed mice to No Tx mice. (G) Immunofluorescence microscopy of buccal mucosa 8 h after swabbing with gp33 or SIIN peptide (top row). Two SIIN-swabbed mice are shown to portray heterogenous anatomic localization of CD45+ cell clusters upon oral TRM reactivation. Nuclear and E-Cadherin stains removed (middle, bottom). Bottom: Enlarged images with arrowheads highlighting OT-I T cells within inflammatory clusters. Scale bars represent 100 µm. Representative images are from at least three buccal mucosa sections, per mouse, of three or more individual mice per group. (H–L) Fold change in DEGs related to microbial sensing (H), keratin and mucus production (I), opsonization (J), neutrophil (PMN) degranulation and metal sequestration (K), and compliment activation and mucosal IgA secretion (L) in gp33-treated mice (gray) and SIIN-treated mice (red) relative to No Tx mice (white). Dots in H–L represent individual mice.

