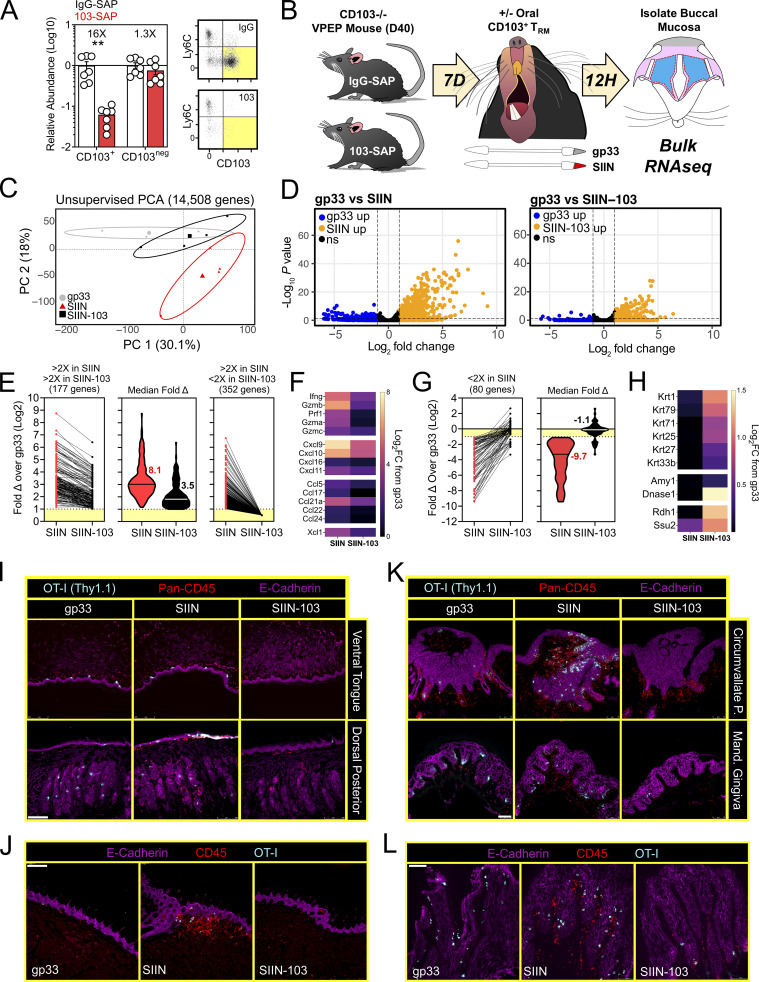
Figure 8.
CD103+ TRM mediate transcriptional changes in the oral mucosa upon antigen sensing. (A) Relative abundance (left) and representative flow cytometry (right) of CD103+ and CD103neg OT-I T cells from the oral mucosa of VPEP memory mice treated with SAP-IgG or SAP-103 antibodies. Data represent three independent experiments (N = 2–3 mice per group per experiment). Flow cytometry plots are concatenated from two mice per group from one experiment. (B) OT-I T cells were expanded through VPEP in CD103−/− hosts. Treatment groups included gp33, SIIN, and SIIN-103, with groups established based on OT-I T cell frequencies in blood. 12 h after swabbing, buccal mucosa was isolated, and bulk RNAseq was performed. (C) Unsupervised PCA plots showing clustering of gp33 (gray), SIIN (red), and SIIN-103 (black) treatment groups. (D) Volcano plots highlighting DEGs significantly (FDR P value <0.05) upregulated (>1log2 fold change [FC]; orange) or downregulated (<1log2 FC; blue) between gp33- vs. SIIN-treated buccal mucosa (left) or gp33- vs. SIIN-103–treated buccal mucosa (right). N = 3 (gp33) or 4 (SIIN, SIIN-103) mice per treatment group. (E) Fold change over gp33 of all significantly upregulated DEGs in SIIN mice and their corresponding relative expression in SIIN-103 mice. (F) Heatmaps showing Log2 fold change of select T cell effector molecule and chemokine genes significantly upregulated in SIIN mice relative to gp33-treated mice, and their corresponding expression levels upon CD103+ TRM depletion and SIIN swabbing. (G) Fold change over gp33 of all significantly downregulated DEGs in SIIN mice and their corresponding relative expression in SIIN-103 mice. (H) Heatmaps showing Log2 fold change of select keratin, digestion, and odontogenesis genes significantly downregulated in SIIN mice relative to gp33 treated mice, and their corresponding expression levels upon CD103+ TRM depletion and SIIN swabbing. (I) Representative tongue histology from gp33-, SIIN-, or SIIN-103–treated mice. Images acquired at 10× magnification. Scale bar represents 250 µm. (J) Additional representative tongue histology as in I. Scale bar represents 200 µm. (K) Representative histology of circumvallate papillae (top) and gingiva (bottom) from gp33-, SIIN-, or SIIN-103–treated mice as in J. Images acquired at 20× magnification. Scale bar represents 75 µm. (L) Additional higher magnification image of gingiva as in K. Scale bar denotes 100 µm. Representative images are from at least three sections, per tissue, per mouse, of three to four individual mice per group. Dots in A represent individual mice. **, P < 0.01 in A determined by an unpaired Student’s t test between SAP-IgG- vs. SAP-103–treated mice.

