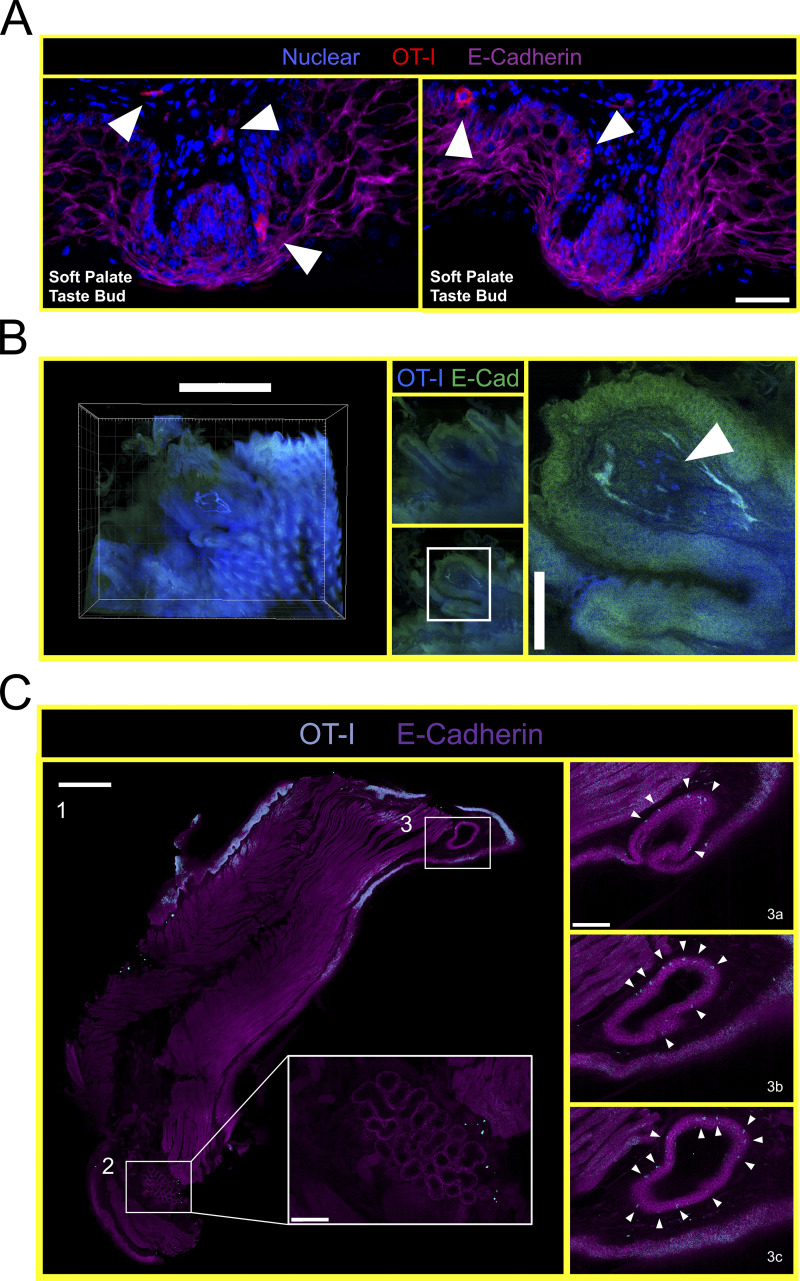
Figure S2.
VPEP-elicited OT-I T cells surveil taste buds of the soft palate, circumvallate papillae, and minor salivary glands and ducts in the buccal mucosa. (A) Immunofluorescence images of two separate soft palate taste buds located immediately distal to the eighth palatine ridge. Blue = nuclear, red = OT-I, pink = E-Cadherin. Scale bar represents 50 µm. Taste buds identified based on location and crescent morphology. Arrowheads denote location of OT-I T cells. (B) Ce3D imaging of OT-I T cells within the circumvallate papillae of a VPEP memory mouse. Scale bars in left and right panels represent 500 and 100 µm, respectively. Arrowhead denotes location of OT-I T cells. (C) Ce3D on isolated buccal mucosa >30 d after VPEP. Individual 2-D slices from overall 3-D structure are shown in all panels. (1) Entire cleared buccal mucosa slice, highlighting a minor salivary gland (bottom of image; 2) and a salivary duct (top of image; 3). Scale bar represents 500 µm. (2) Enlarged image of buccal mucosa minor salivary gland. Scale bar represents 100 µm. (3a–c) Magnified images of buccal mucosa salivary duct, showing three different images through the Z plane. Scale bar represents 100 µm. Arrowheads denote OT-I T cells. Ce3D images are representative of at least two VPEP memory mice in which Ce3D was performed.

