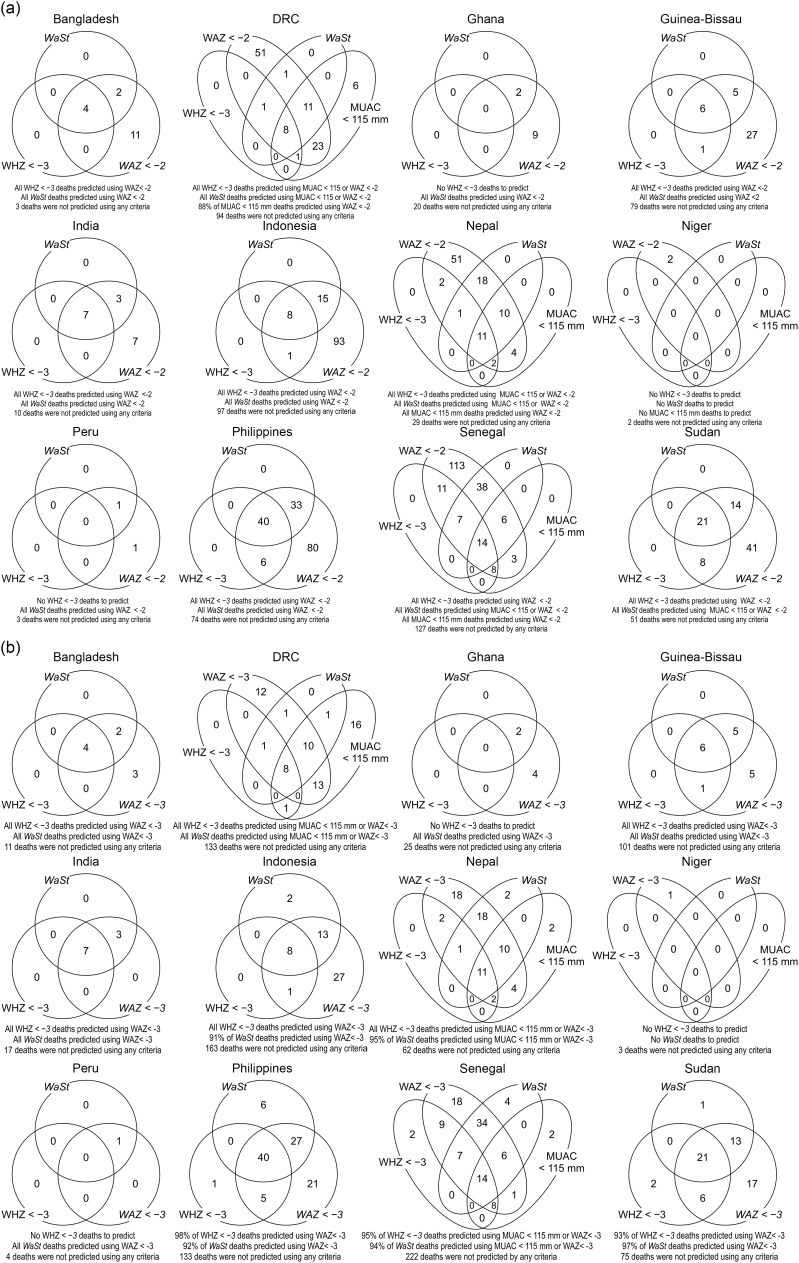
Fig. 2.
(a) Venn diagram analysis for the ability of MUAC < 115 mm (if present) or WAZ < −3 to predict deaths associated with WHZ < −3 or WaSt in twelve cohorts. (b) Venn diagram analysis for the ability of WAZ < −2 to predict deaths associated with WHZ < −3 or WaSt in twelve cohorts.
Note: MUAC, mid-upper arm circumference; WAZ, weight-for-age Z-score; WHZ, weight-for-height Z-score.

