. 2023 Apr 4;19(16):2970–2976. doi: 10.1039/d2sm01606k

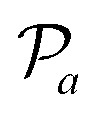
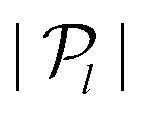
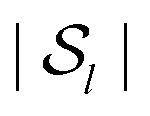
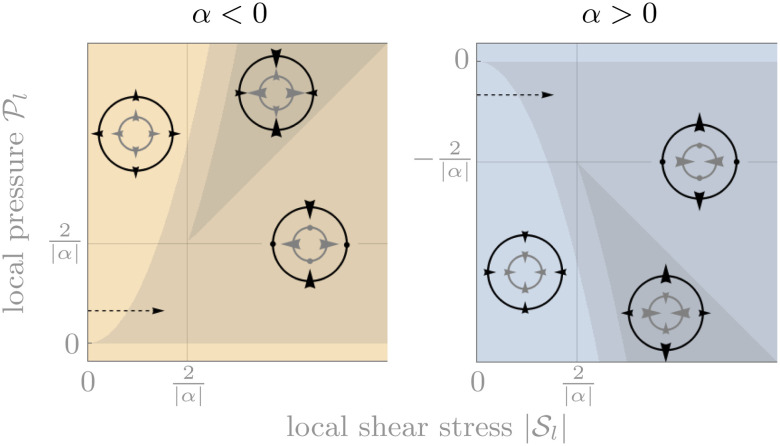
Fig. 3. Dependence of the signs of the components of the active stress as functions of the local stress components. Concentric circles illustrate the qualitative rectification situation in each region, with grey (black) arrows indicating directions of the elements of the local (active) stress. Regions without shading correspond to situations where the signs of the active stress components are the same as in the absence of rectification. In regions with intermediate shading (Inline graphic), the sign of Inline graphic is reversed. In the dark regions, Inline graphic and Inline graphic are so large that all components of Created by potrace 1.16, written by Peter Selinger 2001-2019 a (dark regions) are reversed [ESI]. These changes of signs are illustrated by arrows in the small pictures. Some arrows are replaced by circles in the intermediate shading regime to indicate that they are smaller than the other arrows and can point either way. Note that changes in the values of the dimensionless parameters rout/rin, κ/μ, κ1 and μ1 result in a rescaling of these diagrams through the value of α, but leave them otherwise unaffected.

Fig. 3