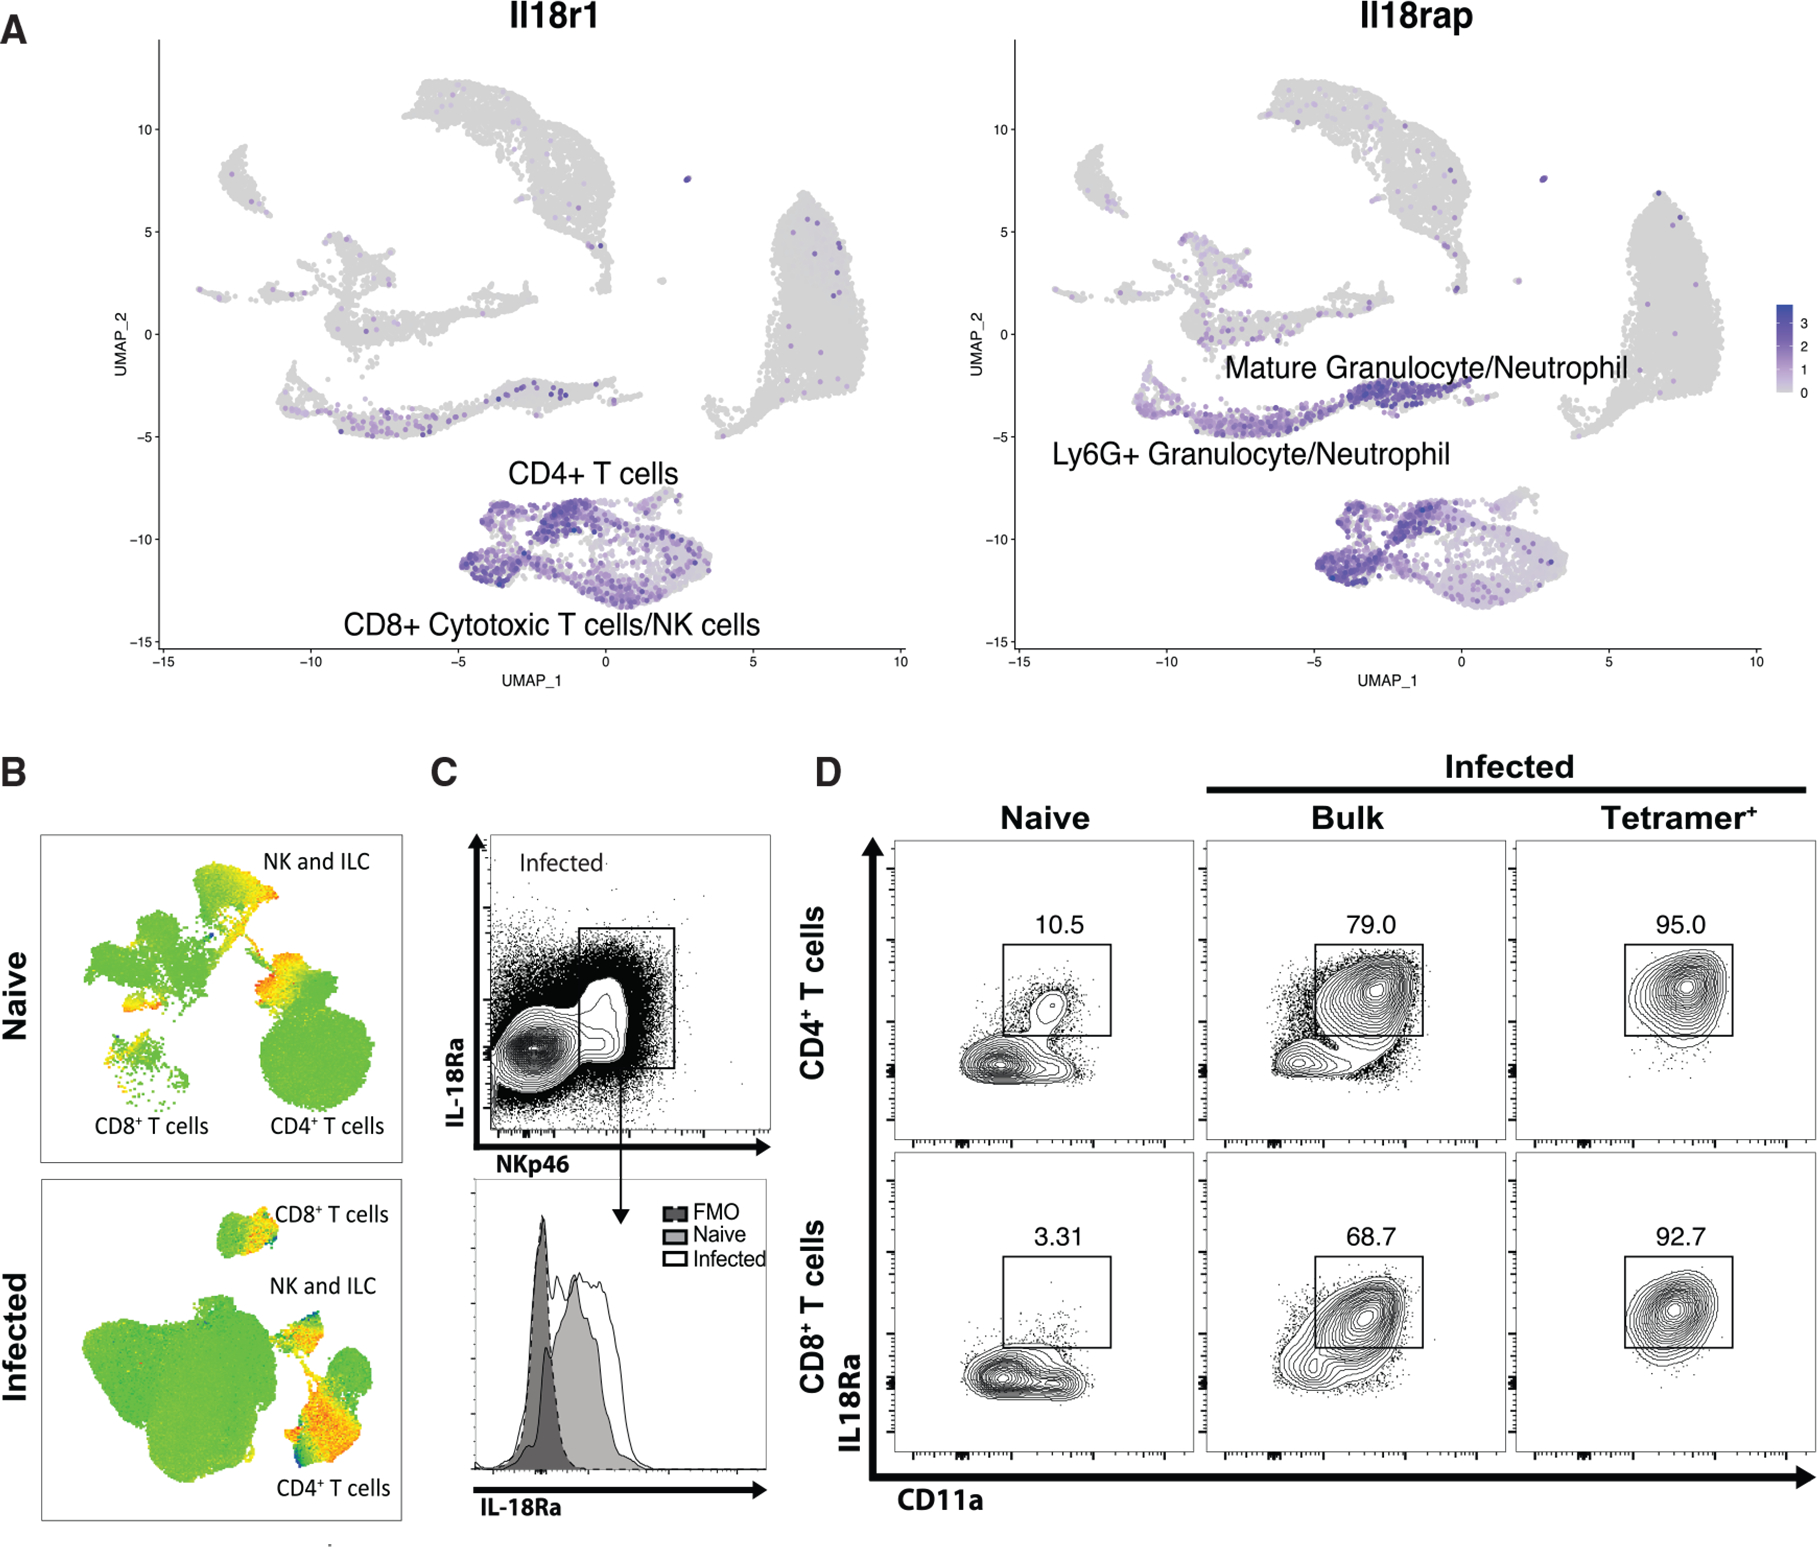
Figure 2. IL-18R is expressed during acute T. gondii infection.

(A) As in Figure 1, single-cell RNA-seq was performed on splenocytes from B6 mice infected with T. gondii at 14 dpi. UMAP analysis was used to generate clusters according to cellular lineage, and expression heatmaps for Il18r1 and Il18rap were overlaid.
(B) Flow cytometry was performed on splenocytes from naive and infected B6 mice at 10 dpi. UMAP analysis was performed to generate clusters according to cellular lineage. Heat maps for IL-18Rα staining are shown.
(C) Rag1−/− mice were infected with T. gondii. At 7 dpi, flow cytometry was performed on peritoneal cells. Population show is pregated on live singlets.
(D) B6 mice were infected with T. gondii. At 10 dpi, splenocytes were analyzed by flow cytometry alongside naive controls. Populations shown are pregated on live CD4+ or CD8+ T cells.
Data are representative of three independent experiments (B–D).
