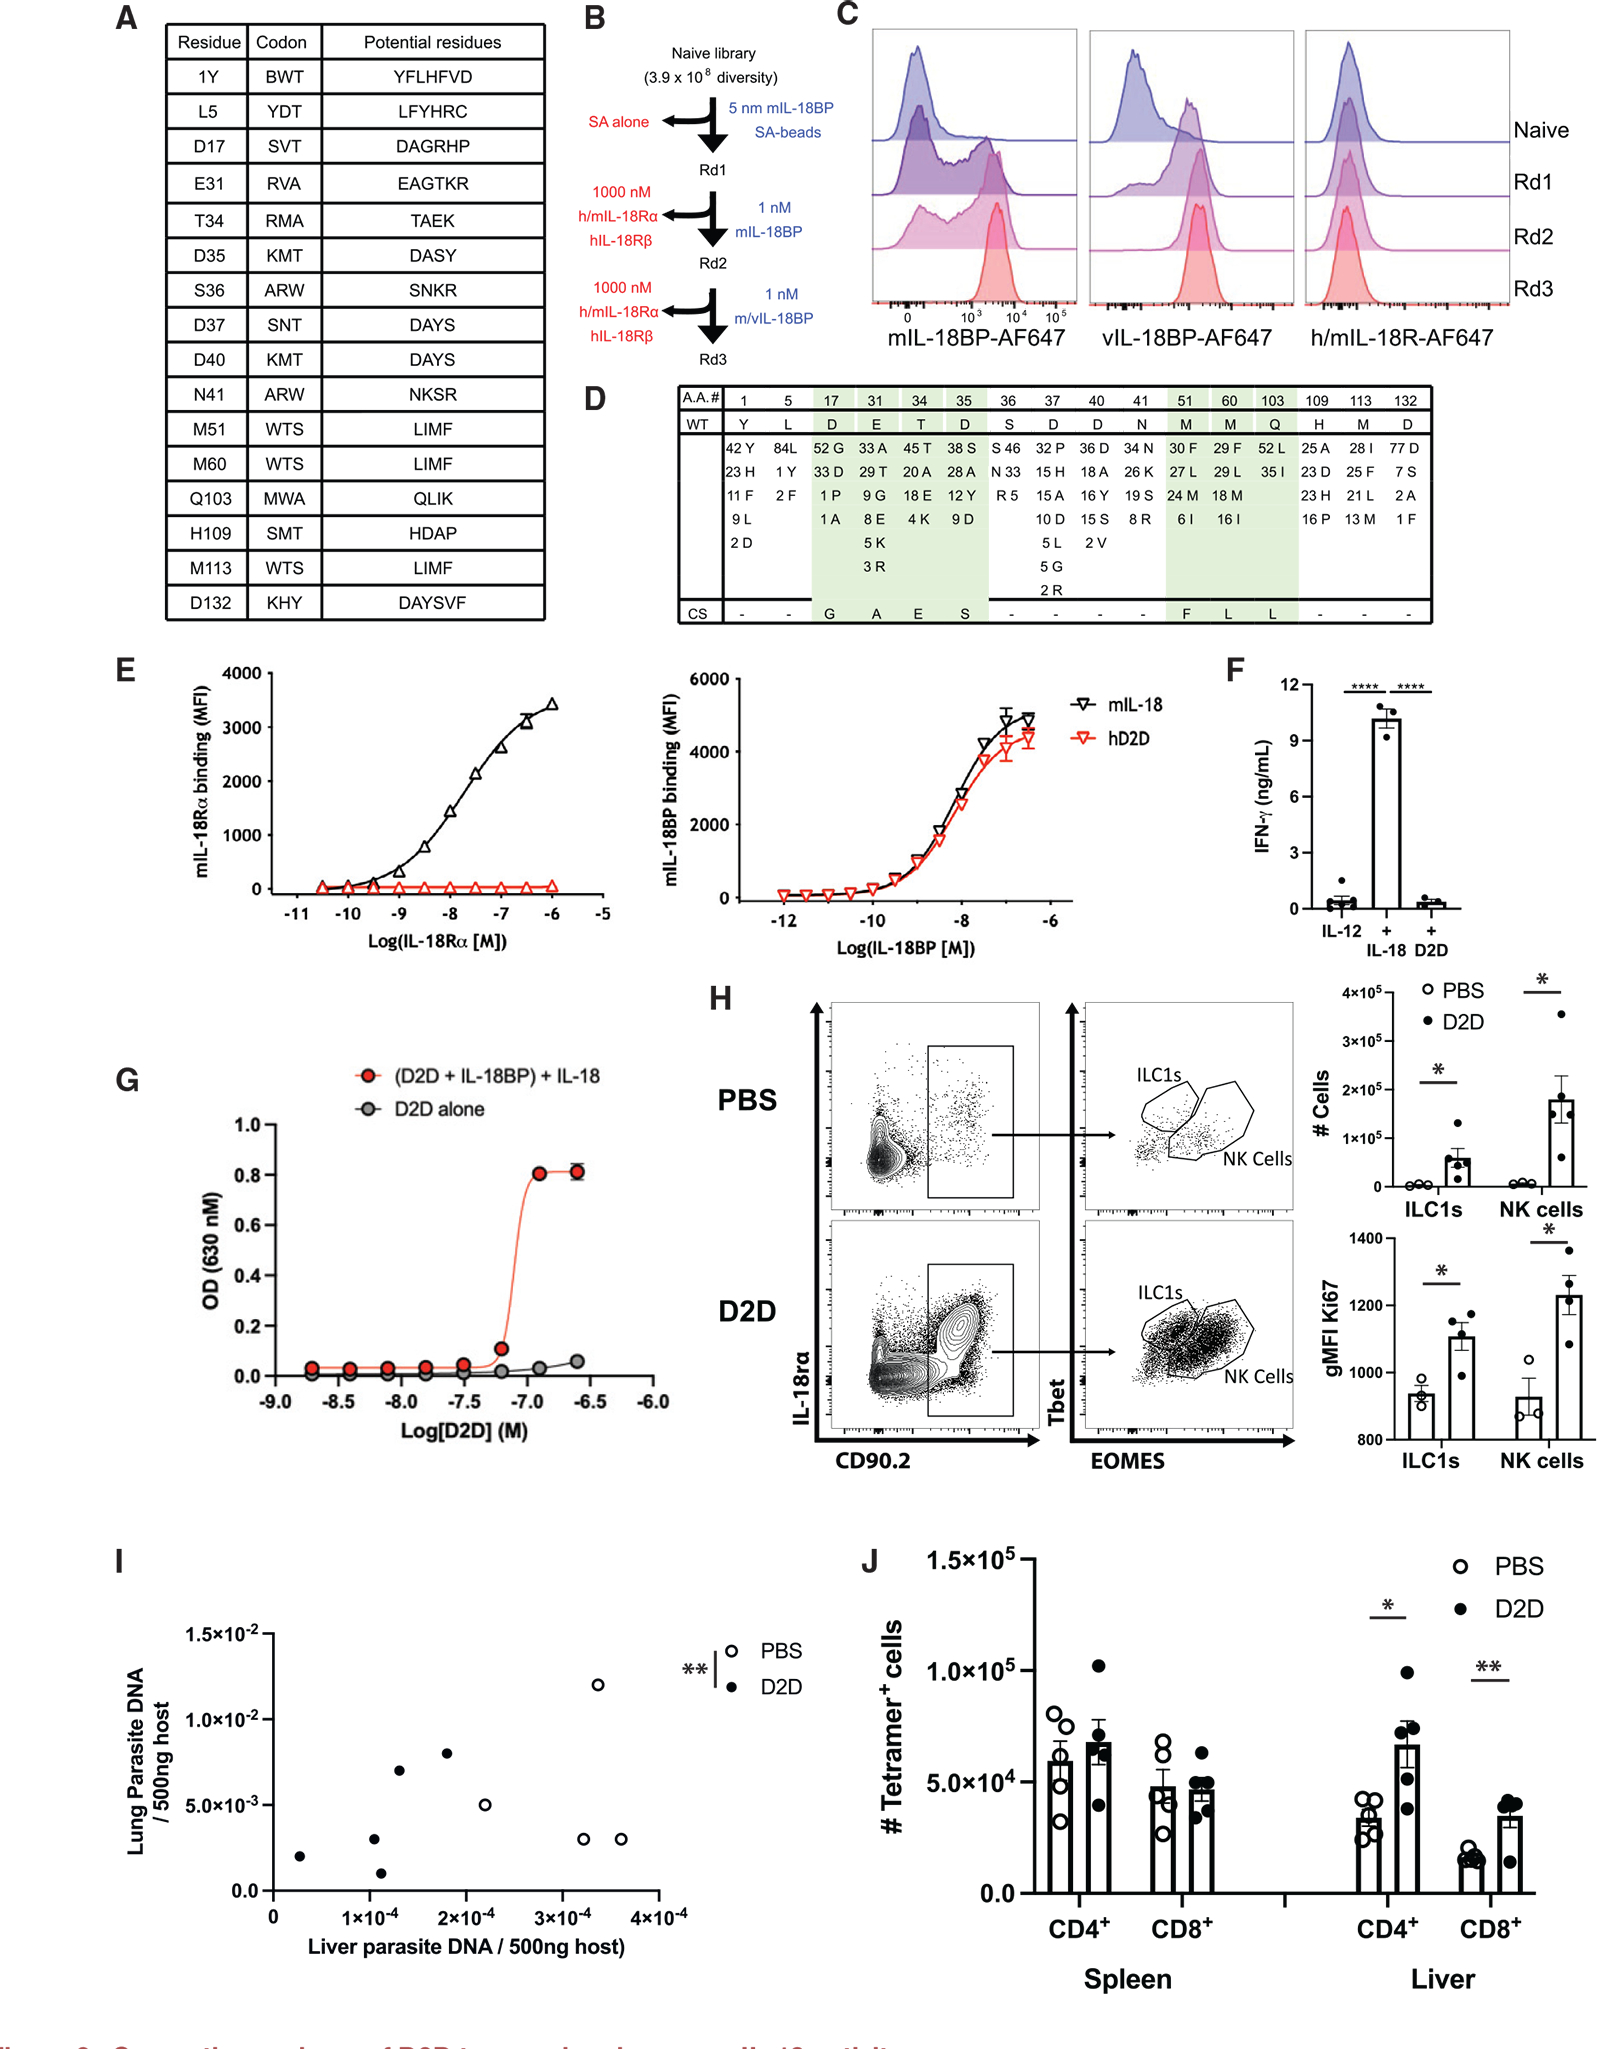
Figure 3. Generation and use of D2D to reveal endogenous IL-18 activity.

(A) Randomized positions of human (h) IL-18 to create D2D, with the corresponding degenerate codon and the potential amino acid at each position.
(B) Summary of the experimental design for directed evolution and yeast selection process to generate D2D. Yeast libraries were selected for mouse (m) and viral (v) IL-18BP binding and counter-selected with streptavidin (SA; round 1) and m/hIL-18Rα and hIL-18Rβ receptors (rounds 2 and 3) using magnetic-activated cell sorting (MACS; round 1) and subsequently fluorescence-activated cell sorting (FACS; rounds 2 and 3). Blue text (right) indicates positive selection reagent, and red text (left) shows the counter-selection reagent.
(C) Representative histogram assessing mIL-18BP (10 nM, left), vL-18BP (10 nM, middle), and IL-18 receptor (m/hIL-18Rα and hIL-18Rβ, 100 nM each, right) staining by flow cytometry of yeast display library after each round of selection.
(D) The sequences of 87 clones summarized for selected D2D variants, with differences for wild-type IL-18 indicated for each mutant at the given amino acid position (top). Number indicates number of clones that shared same residue change. Green shading highlights converging residues to form consensus sequence (bottom).
(E) Dose-response curves comparing binding of mIL-18 and human D2D displayed on yeast to mIL-18Rα and mIL-18BP.
(F) Quantification of INF-γ ELISA from supernatants of lymphokine activated killer cells stimulated with the cytokines listed.
(G) IL18B neutralization curve generated by addition of recombinant IL-18, IL-18BP, and D2D protein to IL-18 signaling reporter cell line.
(H) Rag1−/− mice were infected with T. gondii. At 7 dpi, flow cytometry of peritoneal cells was performed. Populations shown are pregated on live singlets. Quantification of cell numbers and intracellular staining shown on right.
(I) Quantification of parasite DNA isolated from host liver and lung tissue, Rag1−/− mouse, 7 dpi. Units are ng parasite DNA/500 ng host DNA. Statistical significance was determined by combined analysis of the parasite burden in lung and liver of individual mice.
(J) B6 mice were infected with T. gondii, and at 10 dpi, the number of tetramer+ CD4+ and CD8+ cells was analyzed by flow cytometry. Summary data are shown. NS, not significant (p > 0.05); *p < 0.05, **p < 0.01 (Student’s t test). Data are representative of 2 independent experiments (A–D). Data are displayed as mean ± standard error.
