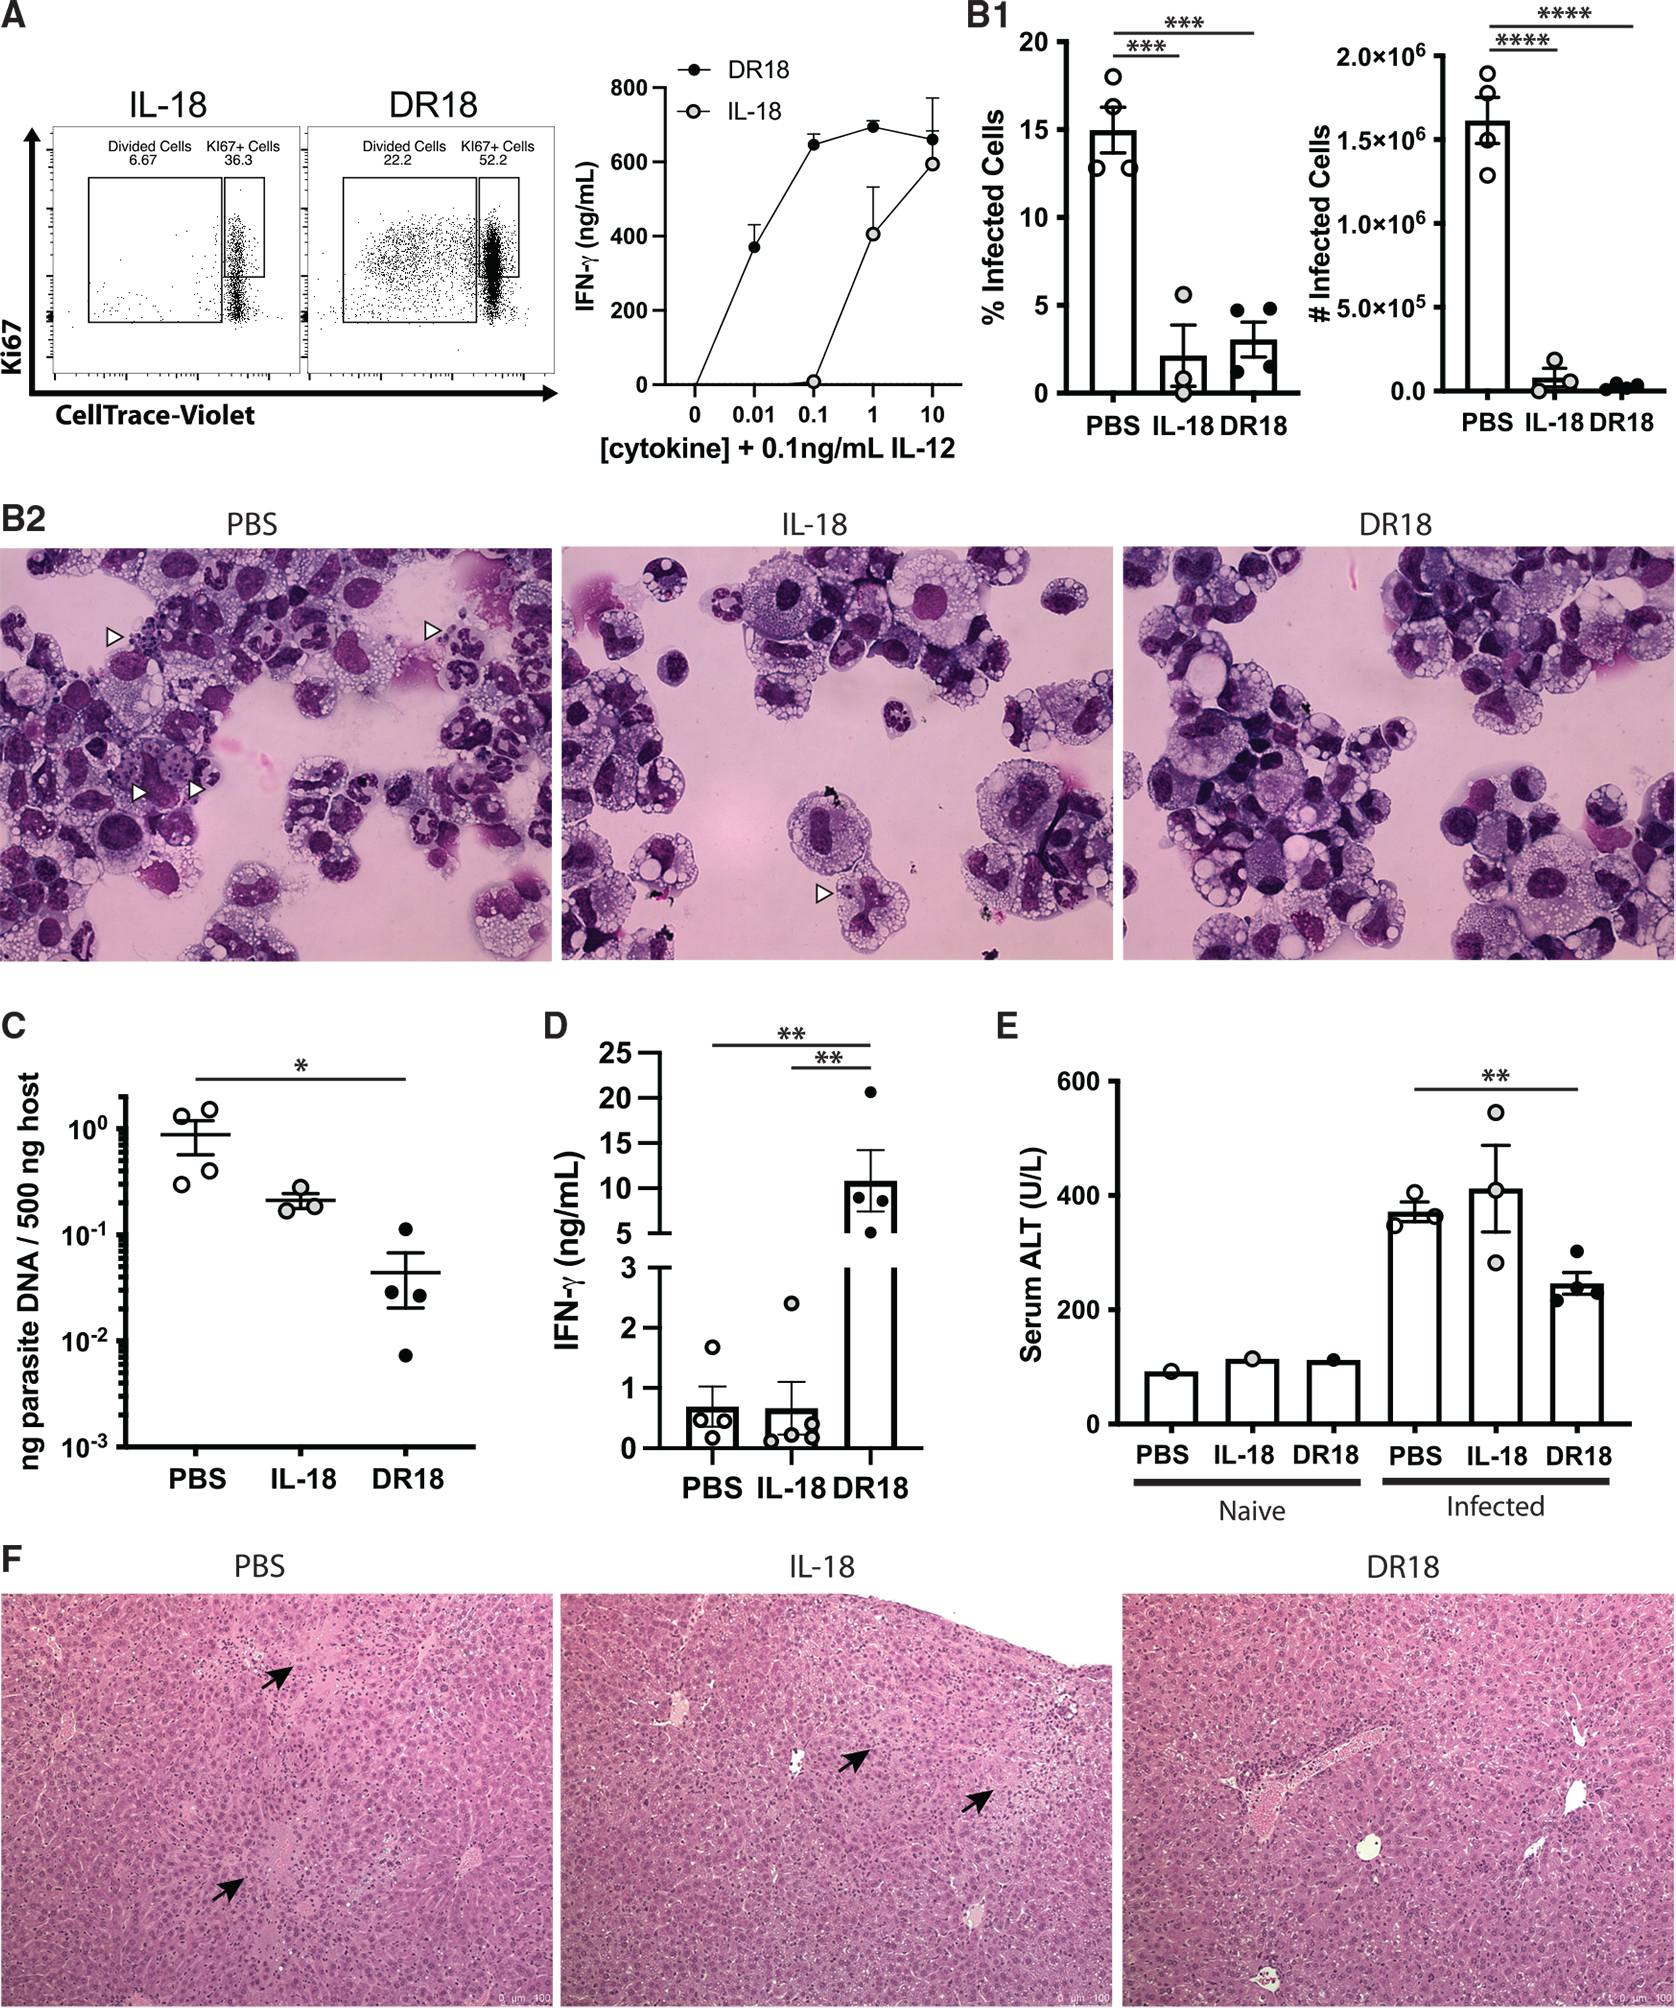
Figure 4. DR18 treatment promotes systemic protective immunity in Rag1−/− mice.

(A) Intracellular staining (left) and ELISA from supernatants (right) of lymphokine activated killer cells stimulated with the cytokines listed.
(B) Quantification of cytospins from peritoneal exudate cells of infected Rag1−/− mice at 7 dpi (top) and representative cytospins (bottom).
(C) Quantification of parasite DNA isolated from lung tissue.
(D) ELISA from serum of Rag1−/− mice at 7 dpi treated as described.
(E) Serum ALT values obtained from Rag1−/− mice at 7 dpi treated as described.
(F) Histology of livers from Rag1−/− mice at 7 dpi treated as described. Black arrows indicate necrotic lesions.
Data are representative of two (A) or 3 (B–F) independent experiments. *p < 0.05, **p < 0.01, ***p < 0.001, ****p < 0.0001 (Student’s t test, A, ordinary one-way ANOVA with Tukey’s multiple comparisons test, B–D, and Welch’s ANOVA with Dunnett’s multiple comparisons test, E). Data are displayed as mean ± standard error.
