
Figure 5. DR18 drives protective NK cell responses in Rag1−/− mice.
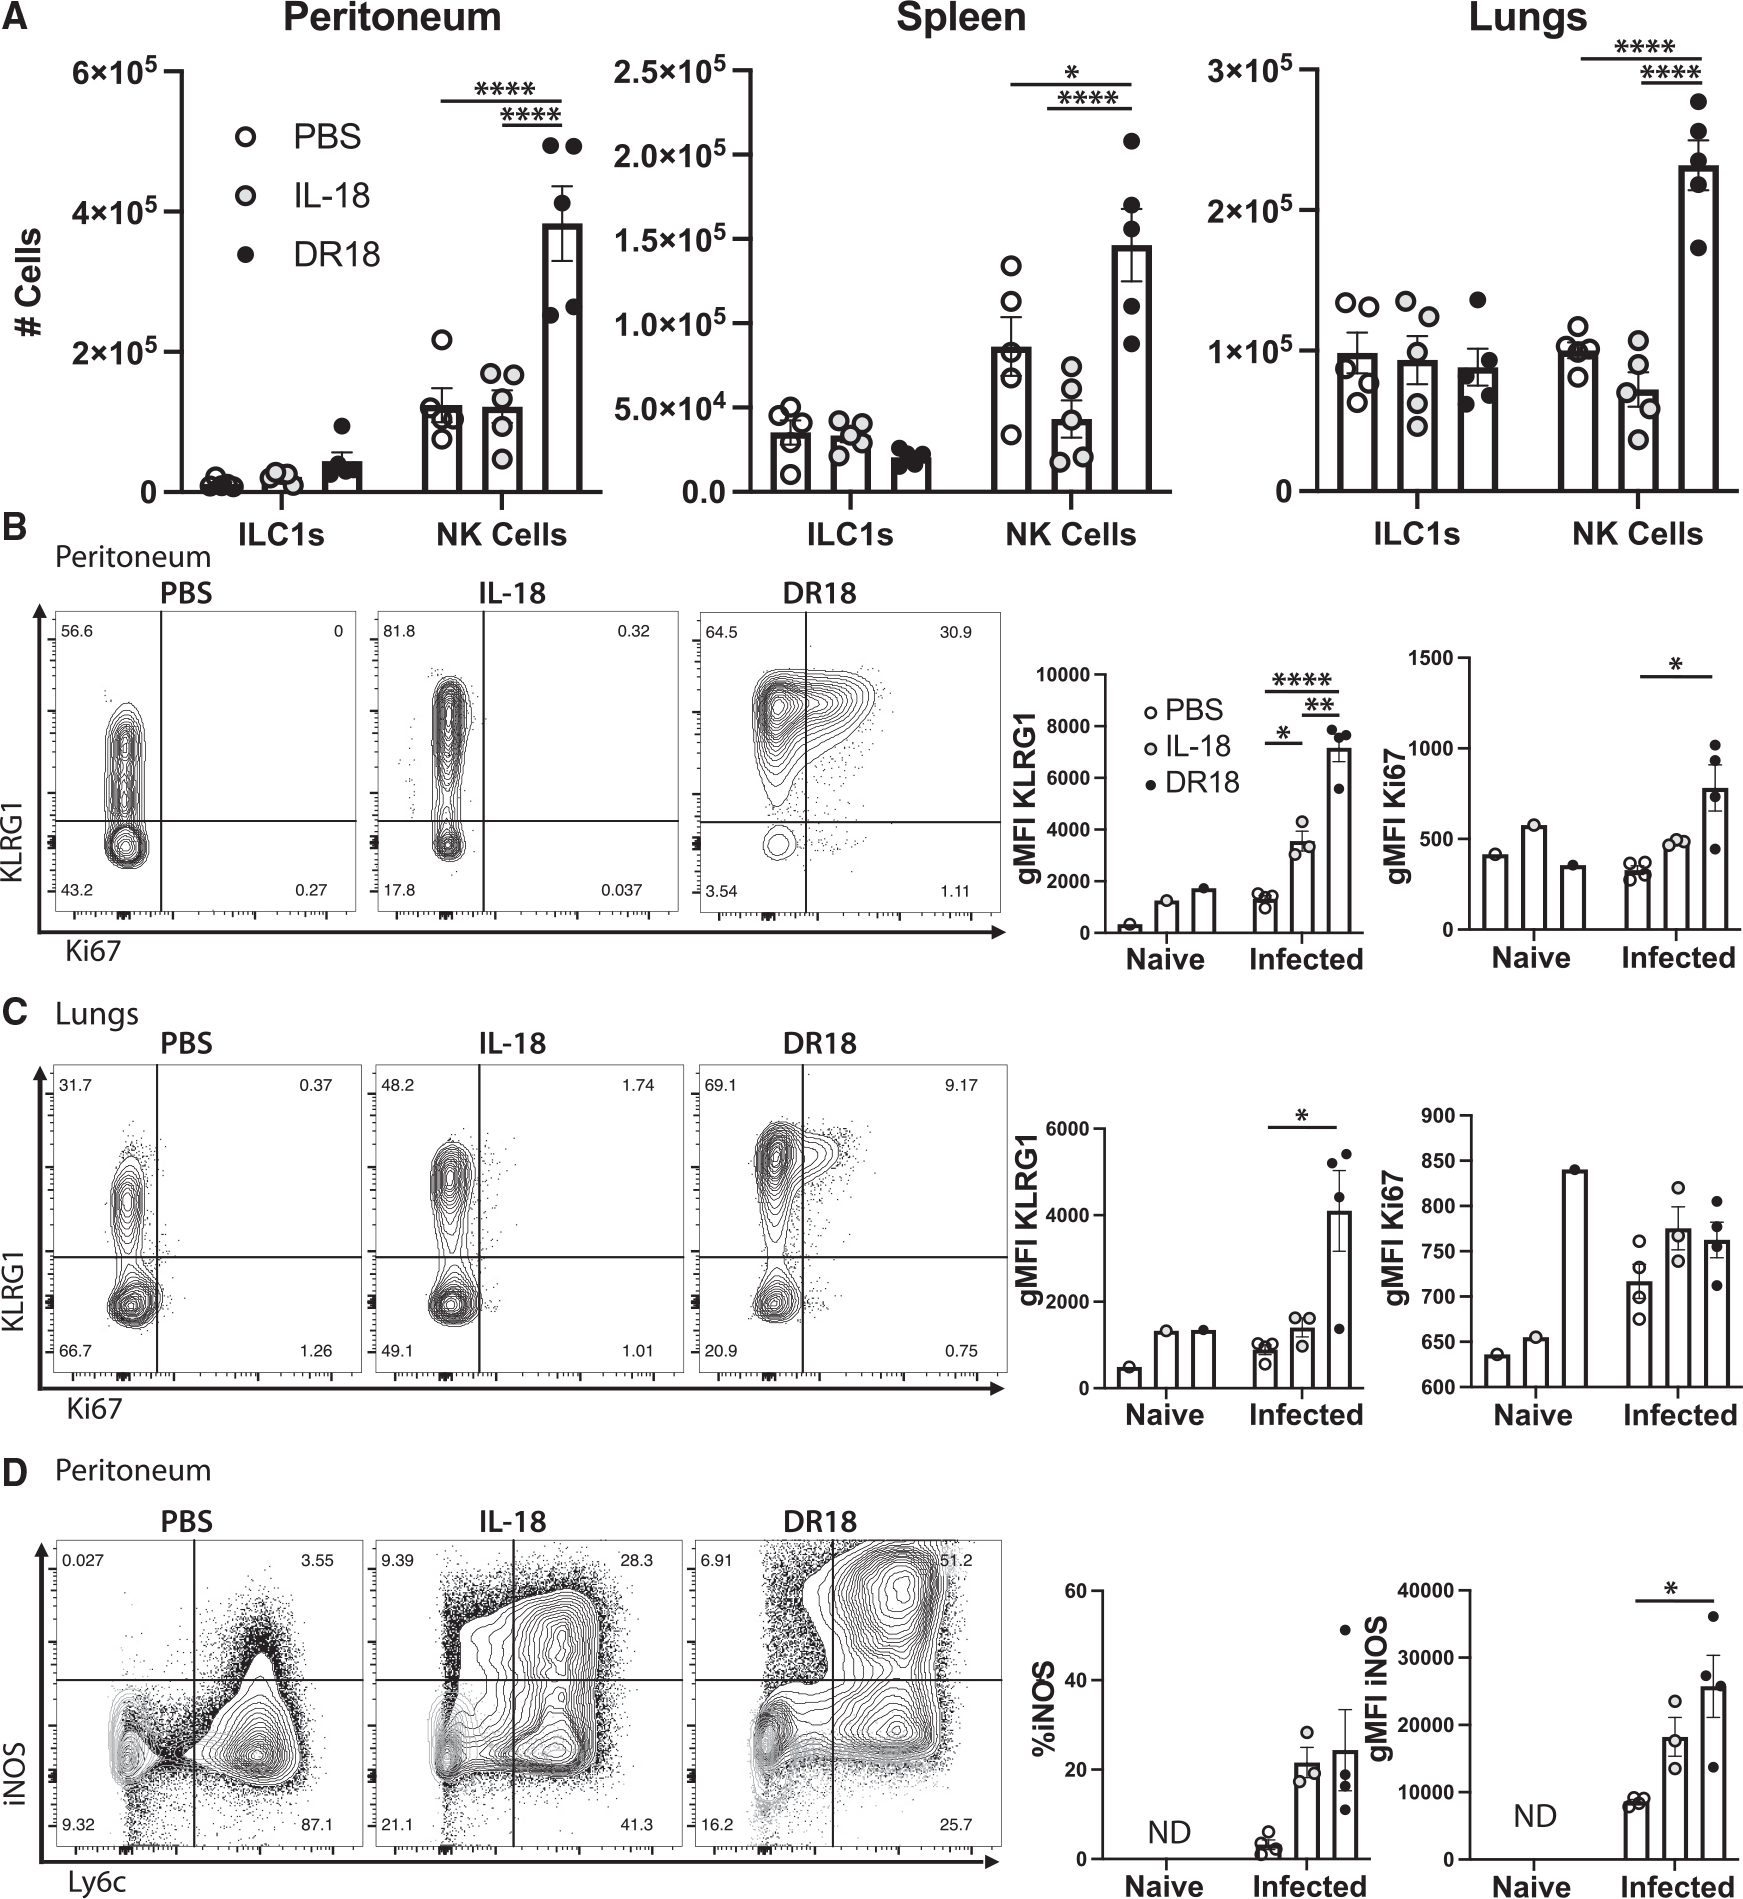
(A) Quantification of cells from Rag1−/− mice at 7 dpi from the tissues listed. ILC1s are defined as NK1.1+ Tbet+ EOMES− cells, and NK cells are NK1.1+ Tbet+/− EOMES+.
(B) Flow cytometry and quantification of NK cell phenotypes in the peritoneum and (C) in the lungs (D) of mice infected with T. gondii.
(D) Flow cytometric analysis and quantification of myeloid cells in the peritoneum. Populations shown are pregated on live CD11b+ Ly6g− singlets. ND, not detected. NS, not significant.
Data are representative of 3 (A–C) or 2 (D) independent experiments. *p < 0.05, **p < 0.01, ****p < 0.0001 (two-way ANOVA with Tukey’s multiple comparisons test, A–C, and one-way ANOVA with Tukey’s multiple comparisons test, D). Data are displayed as mean ± standard error.