Figure 2.

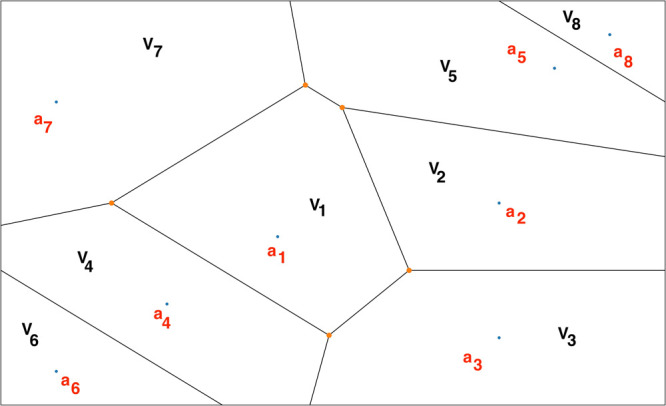
A representative Voronoi diagram where V1, V2, V3, .···, Vn represent the Voronoi cells, and a1 ∈ V1, a2 ∈ V2, a3 ∈ V3, .···, an ∈ Vn.

A representative Voronoi diagram where V1, V2, V3, .···, Vn represent the Voronoi cells, and a1 ∈ V1, a2 ∈ V2, a3 ∈ V3, .···, an ∈ Vn.