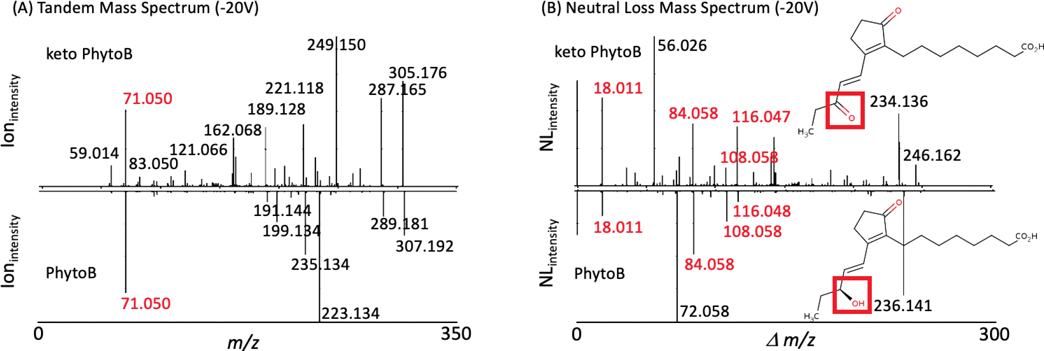
Figure 2.
MS2 and NL data on two related oxylipins (16 keto 16-B1-PhytoP and 16-B1-PhytoP) and the statin drugs rosuvastatin and desmethyl rosuvastatin. (A) Oxylipin MS2 data show little overlap (in red) in contrast to the (B) NL spectra with the high resolution neutral loss data facilitating similarity analysis with both providing complementary structural information. The red box denotes the only (minor) structural differences between the two molecules.

