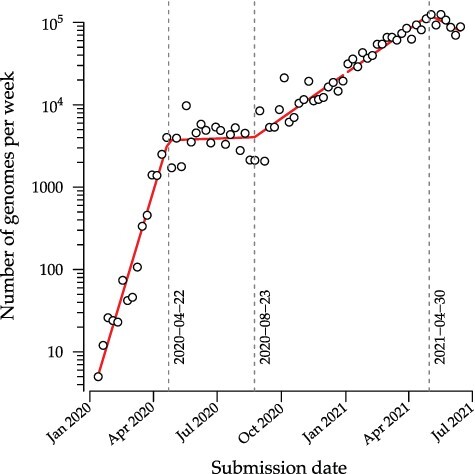
Figure 1.

Weekly numbers of genomes submitted to the GISAID database (accessed on 26 June 2021). Red line segments represent the fit of a piecewise linear regression with three change points (indicated by vertical dashed lines) using the R package segmented (Muggeo 2008). An increasing linear trend relative to a log-transformed y-axis indicates an exponentially growing rate of genome submission.
