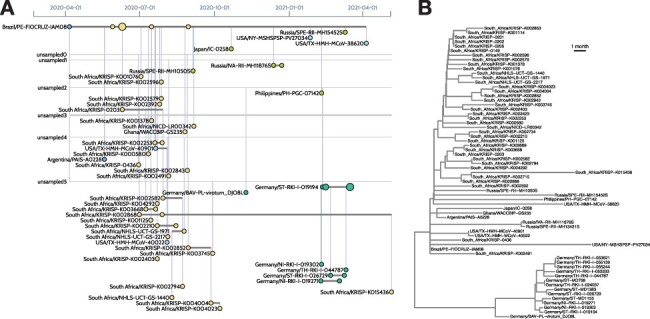
Figure 3.

Visualizing the sample composition of a lineage. (A) The left image was generated by the CoVizu website for lineage B.1.1.117, using data retrieved from GISAID on 20 June 2021. Each horizontal line represents genomes that are indistinguishable in sequence (comprising a ‘variant’), labeled by the name of the earliest sample. For example, Brazil/PE-FIOCRUZ-IAM08 (upper left) was sampled on 6 April 2020, and identical genomes were subsequently observed in six samples in South Africa. This pattern is consistent with the importation of this variant from Brazil to South Africa. A more recent variant (Germany/ST-RKI-I-019194, seven samples) is ancestral to several other variants sampled in Germany (lower right). It is derived from an unsampled ancestral variant (‘unsampled2’) at a distance of 3.8 mutations, averaged over 100 bootstrap replicates, which in turn is separated from Brazil/PE-FIOCRUZ-IAM08 by a mean of 10.5 mutations. These lengths imply that this lineage is relatively undersampled. (B) For comparison, the right image depicts a time-scaled tree generated from the same data using FastTree2 and TreeTime. In this visualization, it is more difficult to identify samples that are genetically indistinguishable. Thus, beadplots endeavor to visually emphasize features that are relevant for public health applications.
