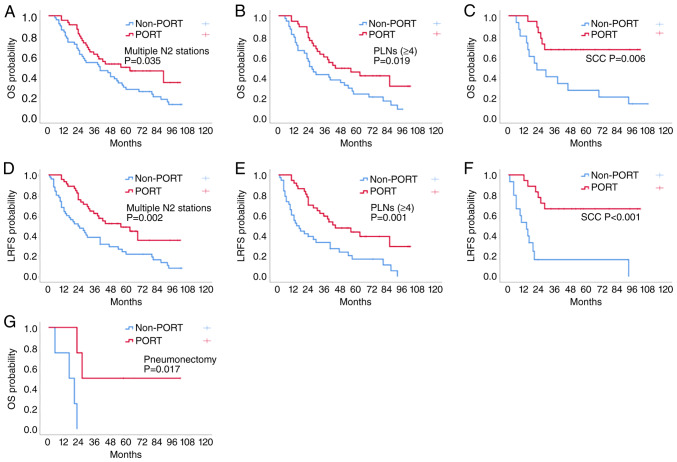
Figure 2.
OS and LRFS of patients in different clinicopathological subgroups according to the use of PORT after propensity score-matching. (A) OS curves for patients with multiple N2 stations. The 5-year OS rate was 49.3% for the PORT group and 27.5% for the non-PORT group. (B) OS curves for patients with N2 PLNs (≥4). The 5-year OS rate was 44.6% for the PORT group and 23.0% for the non-PORT group. (C) OS curves for patients with SCC. The 5-year OS rate was 66.7% for the PORT group and 26.7% for the non-PORT group. (D) LRFS curves for patients with multiple N2 stations. The 5-year LRFS rate was 48.7% for the PORT group and 22.0% for the non-PORT group. (E) LRFS curves for patients with N2 PLNs (≥4). The 5-year LRFS rate was 43.8% for the PORT group and 17.2% for the non-PORT group. (F) LRFS curves for patients with SCC. The 5-year LRFS rate was 66.7% for the PORT group and 16.7% for the non-PORT group. (G) OS curves for patients with pneumonectomy. The 5-year OS rate was 50.0% for the PORT group and 0% for the non-PORT group. LRFS, local recurrence-free survival; OS, overall survival; PLNs, positive lymph nodes; PORT, postoperative radiotherapy; SCC, squamous cell carcinoma.

